In a microservices environment, APIs are the main communication methods between services. Most of time each API merely sends a request and wait for its response. But there are definitely cases that need longer period to complete the requests. Even some cases stop processing at some stage until they get a signal to continue. Those are not uncommon in the API world. However, implementing those features might be a little bit tricky because most APIs use HTTP protocol, which are basically web-based applications that have timeout constraints. The timeout limitation is pretty critical to achieve those long-running processes within a given period of time. Fortunately, there are already solutions (or patterns) to overcome those sorts of challenges – asynchronous patterns and/or webhook patterns. As both are quite similar to each other, they are used interchangeably or together. While those approaches sort out the long-running process issues, they are hard for testing or debugging without some external tools. In this post, we are going to have a look at a couple of useful tools for debugging and testing, when we develop REST API applications, especially webhook APIs.
Disclaimer: those services introduced in this post do not have any sort of relationship to us, Kloud.
RequestBin
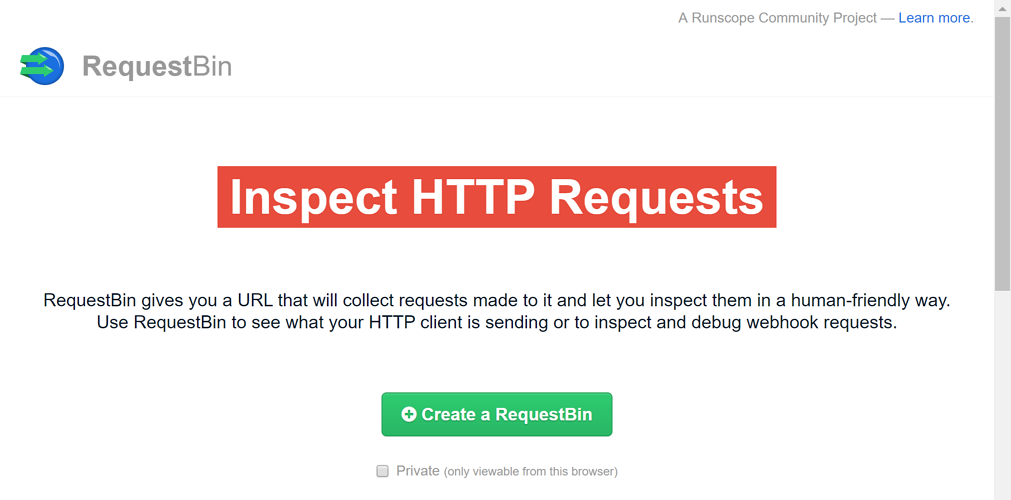
RequestBin is an online webhook request sneaking tool. It has a very simple user interface so that developers can hop into the service straight away. If we want to check webhook request data, follow the steps below:
- Click the
Create a RequestBinbutton at the first page.
-
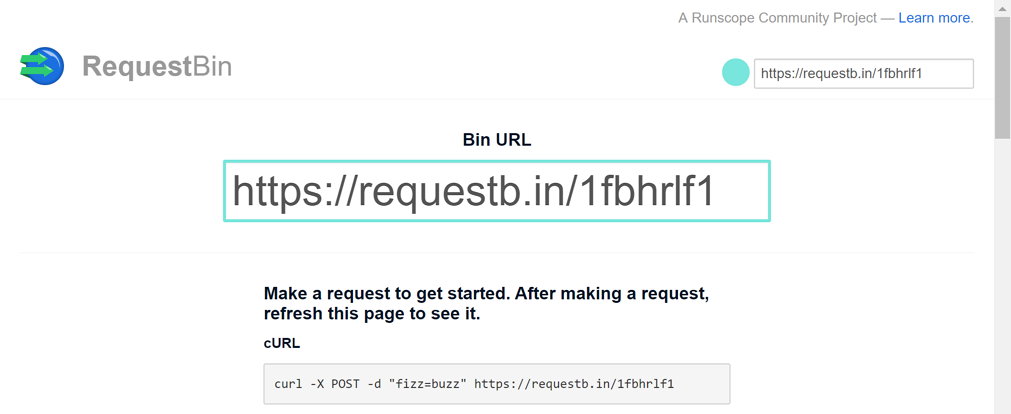
A temporary bin URL is generated. Grab it.
-
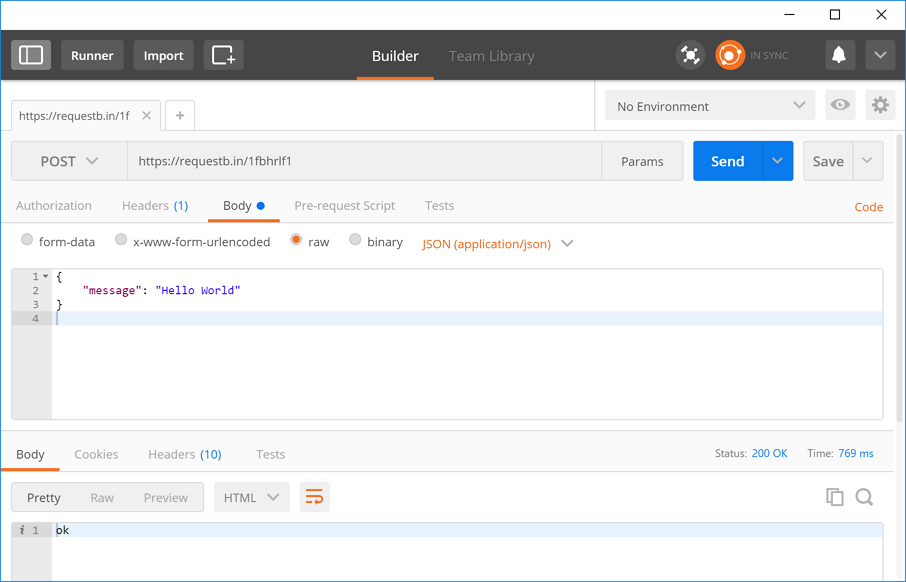
Use this bin URL as a webhook callback URL. Here’s the screenshot using Postman sending a request to the bin URL.
-
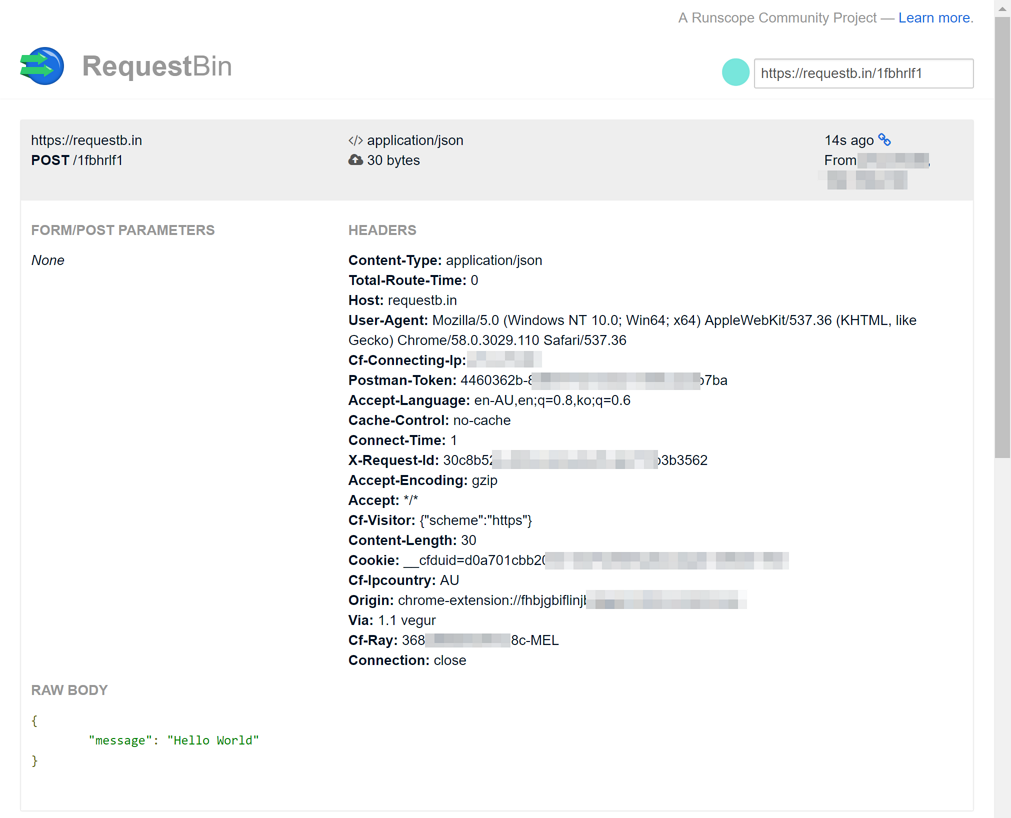
The request data sent from Postman is captured like below. If the bin URL is
https://requestb.in/1fbhrlf1, just append the querystring parameter of?inspectso that we can inspect the request data. Can we find out the same request data sent?
This service brings a few merits. Firstly, we can simply use the bin URL when we register a webhook. The webhook request body is captured at the bin URL. Secondly, we don’t have to develop a test application to analyse the webhook payload because the data has already been captured by the bin URL. Thirdly, we can save time and resources for those testing application development. And finally, it’s free!
Of course, there are demerits. Each bin URL is only available for limited period of time. According to the service website, the bin URL is only valid for the first 48 hours after it’s generated. In fact, the lifetime varies from 5 mins to 48 hours. If we close a web browser and open it again, the bin URL is no longer valid. Therefore, this is only for testing webhooks that have a short lifecycle. In addition to this, RequestBin doesn’t have a good fit when we try local debugging. There must be cases that the webhooks receive data and process it. RequestBin only shows how webhook request data is captured, nothing further.
If RequestBin is not our solution, what else can we use? How can we debug or test the webhook functions?
ngrok
According to this post, tunneling services take traffic from the Internet to local development environment. ngrok is one of those tunneling services. It has both free version and paid one, but the free one is enough for our purpose.
As it supports cross-platforms, download the suitable binary for OS. For Windows, there is only one binary, ngrok.exe. Copy this to the C:\ngrok folder (or wherever preferred) and enter the command below:
[code lang=text]
ngrok http 7071 -host-header=localhost
[/code]
http: This specifies the protocol to watch incoming traffic.7071: This is the port number. Default is 80. If we debug Azure Functions, set this port number to 7071.-host-header=localhost: Without this option, only ngrok captures the traffic but it can’t reach the local debugging environment.
After typing the command above, we can see the screen like below:

As we can see, external traffic hitting the endpoint of http://b46c7c81.ngrok.io can reach our locally running Azure Functions app. Let’s run Azure Functions in a local debugging mode.
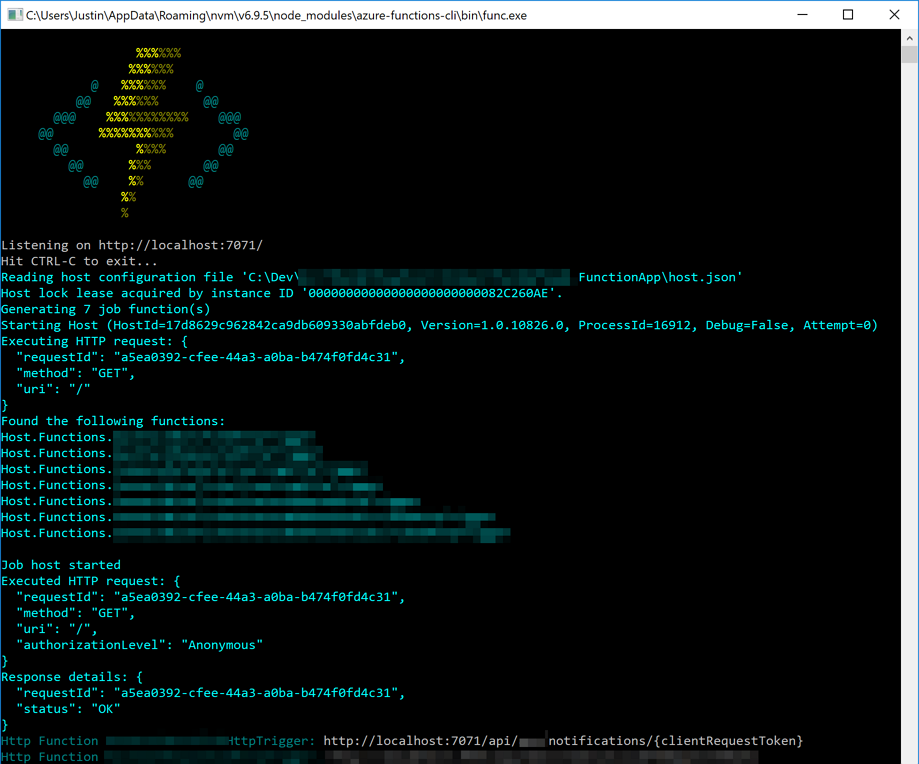
Azure Functions is now up and running. Run Postman and send a request to the endpoint that ngrok has generated.
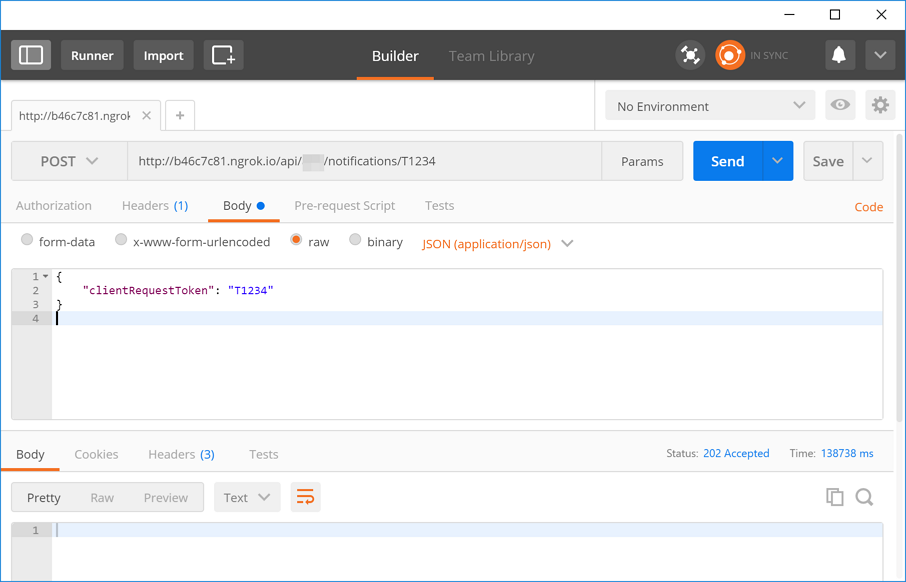
We can now confirm that the code stops at the break point within Visual Studio.

ngrok also provides a replay feature. If we access to http://localhost:4040, how ngrok has captured all requests since it is run.
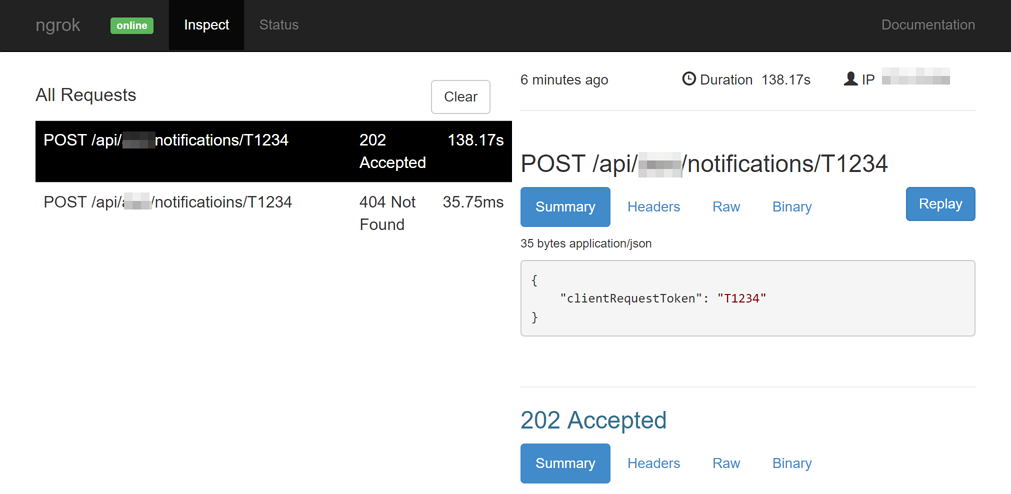
The free version of ngrok keeps changing the endpoint every time it runs. Run history is also blown away. But this wouldn’t matter for our purpose.
So far, we have briefly looked at a couple of tools to sneak webhook traffic for debugging purpose. If we utilise those tools well, we can more easily perform checking how API request calls are made. It would be definitely worth noting.

Comments are closed.