Automating Azure Instrumentation and Monitoring – Part 5: Log Alerts

In the previous part of this series, we looked at the basic structure of Azure Monitor alerts, and then specifically at metric alerts. In this part we will consider other types of alert that Azure Monitor can emit. We will first discuss application log alerts – sometimes simply called log alerts – which let us be notified about important data emitted into our application logs. Next we will discuss activity log alerts, which notify us when events happen within Azure itself.… [Keep reading] “Automating Azure Instrumentation and Monitoring – Part 5: Log Alerts”

Automating Azure Instrumentation and Monitoring – Part 4: Metric Alerts

One of the most important features of Azure Monitor is its ability to send alerts when something interesting happens – in other words, when our telemetry meets some criteria we have told Azure Monitor that we’re interested in. We might have alerts that indicate when our application is down, or when it’s getting an unusually high amount of traffic, or when the response time or other performance metrics aren’t within the normal range. We can also have alerts based on the contents of log messages, and on the health status of Azure resources as reported by Azure itself.… [Keep reading] “Automating Azure Instrumentation and Monitoring – Part 4: Metric Alerts”

Automating Azure Instrumentation and Monitoring – Part 3: Custom Metrics

One of the core data types that Azure Monitor works with is metrics – numerical pieces of data that represent the state of an Azure resource or of an application component at a specific point in time. Azure publishes built-in metrics for almost all Azure services, and these metrics are available for querying interactively as well as for use within alerts and other systems. In addition to the Azure-published metrics, we can also publish our own custom metrics.… [Keep reading] “Automating Azure Instrumentation and Monitoring – Part 3: Custom Metrics”

Automating Azure Instrumentation and Monitoring – Part 2: Application Insights

Application Insights is a component of Azure Monitor for application-level instrumentation. It collects telemetry from your application infrastructure like web servers, App Services, and Azure Functions apps, and from your application code. In this post we’ll discuss how Application Insights can be automated in several key ways: first, by setting up an Application Insights instance in an ARM template; second, by connecting it to various types of Azure application components through automation scripts including Azure Functions, App Services, and API Management; and third, by configuring its smart detection features to emit automatic alerts in a configurable way.… [Keep reading] “Automating Azure Instrumentation and Monitoring – Part 2: Application Insights”

Automating Azure Instrumentation and Monitoring – Part 1: Introduction

Instrumentation and monitoring is a critical part of managing any application or system. By proactively monitoring the health of the system as a whole, as well as each of its components, we can mitigate potential issues before they affect customers. And if issues do occur, good instrumentation alerts us to that fact so that we can respond quickly.

Azure provides a set of powerful monitoring and instrumentation tools to instrument almost all Azure services as well as our own applications.… [Keep reading] “Automating Azure Instrumentation and Monitoring – Part 1: Introduction”

Monitoring Azure Storage Queues with Application Insights and Azure Monitor

Azure Queues provides an easy queuing system for cloud-based applications. Queues allow for loose coupling between application components, and applications that use queues can take advantage of features like peek-locking and multiple retry attempts to enable application resiliency and high availability. Additionally, when Azure Queues are used with Azure Functions or Azure WebJobs, the built-in poison queue support allows for messages that repeatedly fail processing attempts to be moved to a dedicated queue for later inspection.… [Keep reading] “Monitoring Azure Storage Queues with Application Insights and Azure Monitor”

Know Your Cloud Resource Costs on Azure

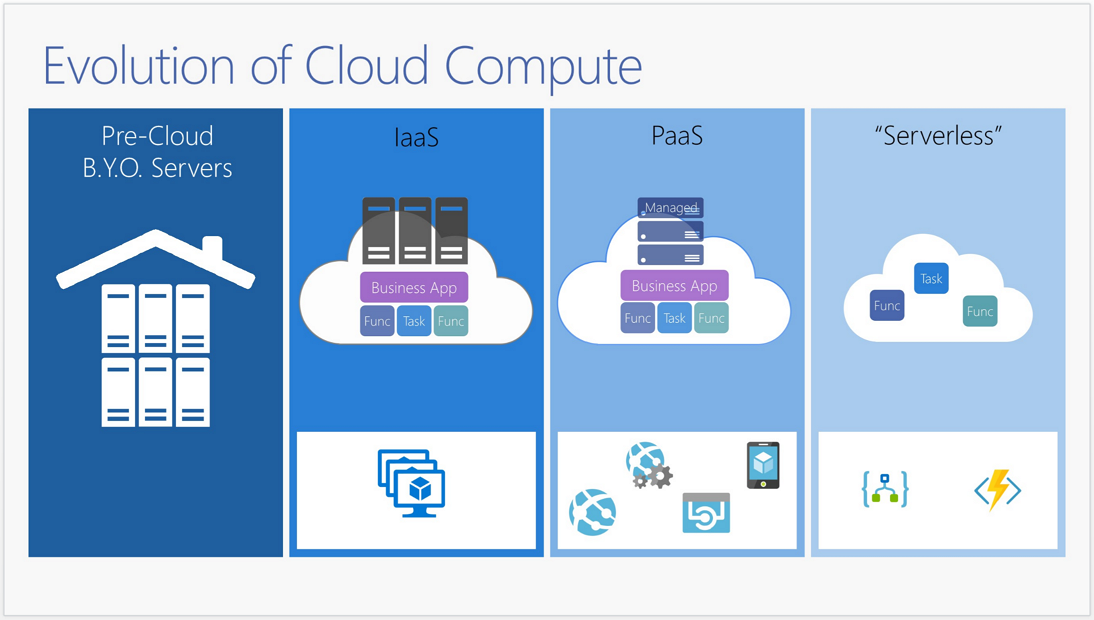
An organisation used to invest their IT infrastructure mostly for computers, network or data centre. Over time, they spent their budget for hosting spaces. Nowadays, in cloud environments, they mostly spend their funds to purchase computing power. Here’s a simple diagram about the cloud computing evolution. From left to right, expenditure shifts from infrastructure to computing power.

In the cloud environment, when we need resources, we just create and use them, and when we don’t need them any longer, we just delete them.… [Keep reading] “Know Your Cloud Resource Costs on Azure”

Monitoring Azure WebJobs Health with Application Insights

Introduction

Azure WebJobs have been available for quite some time and have become very popular for running background tasks with programs or scripts. WebJobs are deployed as part of Azure App Services (Web Apps), which include their companion site Kudu. Kudu provides a lot of features, including a REST API, which provides operations for source code management (SCM), virtual file system, deployments, accessing logs, and for WebJob management as well. The Kudu WebJobs API provides different operations including listing WebJobs, uploading a WebJob, or triggering it.… [Keep reading] “Monitoring Azure WebJobs Health with Application Insights”