
In a previous blog post we explored some of the basics around integration of OMS and Power BI to report on user activity. In this blog post we’ll look at this subject in more detail and show what can be achieved with Power BI Desktop, especially with the updates now available in Azure Log Analytics as part of the Operations Management Suite (OMS).
Power BI presents a wealth of data visualisation capability, primarily as two use types, the online version which is geared toward sharing and collaboration (accessed on this URL: https://app.powerbi.com/) and the Power BI Desktop which is more of a high-powered data import and modelling tool, though both can be used to create visuals.
So, why are we looking at Power BI Desktop? Well, while the online flavour has some definite advantages – such as easy sharing and dashboard as well as the flexibility of being accessible to anyone with a browser, there’s a few things I want to do with my data that I need the Desktop version for – specifically merging multiple queries to create some interesting insights into Office 365 activity.
Our Requirement: Show user activity in SharePoint Online and correlate and filter the data based on the users’ business unit and location.
Now, while the Office 365 Monitoring Solution in OMS provides detailed logging of user activity, aggregation of this data to show interesting things like “how many users in each state are active”, or, “how often are users in the Finance business unit sharing documents externally” is a little difficult. The reason for this is that Office 365 Activity API logs the user’s User Principal Name (UPN), e.g. daisy.smith@contoso.com but no other identifying information. We want to track internal users, as well as those from outside the organisation who have been invited to collaborate.
For those external users, we want to see what groups they are part of and what they are doing in our tenant.
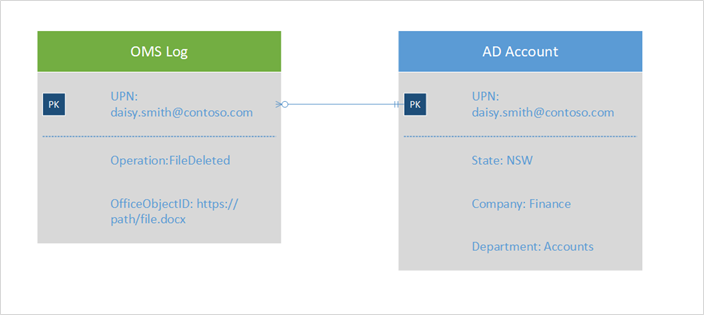
So, if we want to report on activity that is filtered just for an individual business unit or location we need to gather data from the user’s identity source and merge that with the OMS logs.
As we see from the example below, we can match Office 365 logs using the UPN with the user’s Azure AD account, and with that we can enrich our report with all the attributes of that user. And as we’re dealing with two separate datasets, we’re going to use Power BI Desktop and not the online version.
So, we have a few steps here to do:
- Get the OMS log query data into Power BI Desktop
- From Power BI Desktop, query the user’s account to gain attributes
- Create relationships between these datasets in Power BI, based on UPN
- Visualise the data
- Publish to Power BI Online for consumption
An overview of the moving parts:
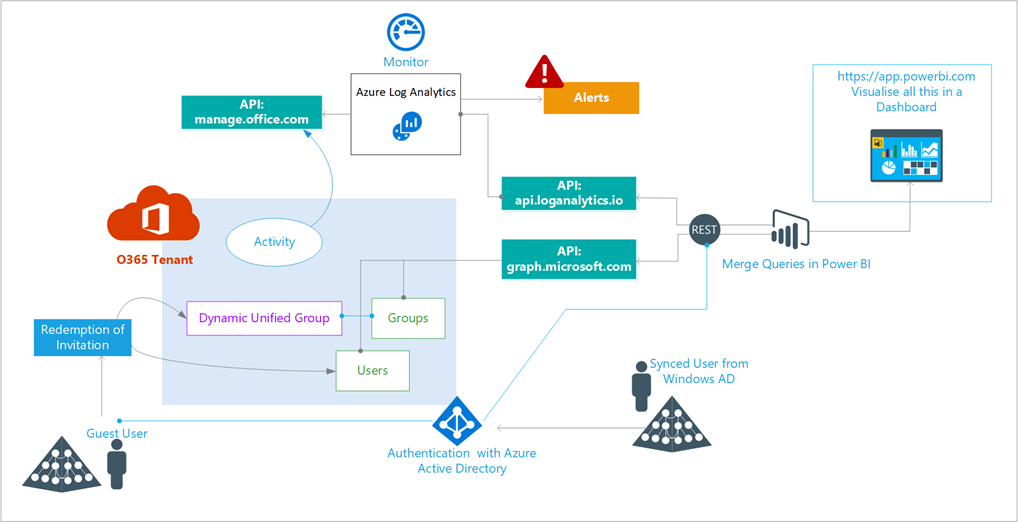
‘The Overview’
Step 1 – get the Azure Log Analytics log query data into Power BI Desktop
Microsoft recently rolled out upgrades for Azure Log Analytics workspaces, and the new iteration integrates quite nicely with Power BI Desktop by exposing a REST API: api.loganalytics.io.
Using Power BI Desktop we can simply drop a query directly into PBI and have it pull directly from your Azure Log Analytics workspace.
Firstly, let’s create a query to get some interesting data from Office 365. Let’s say we want to find out what external users are up to, so here’s a simple query to pull in all logs from externals. Note this is a fairly simple one, in your environment you may want to be more precise and/or aggregate the results into a smaller data set:
OfficeActivity | where UserId contains_cs “#ext#”
Now it’s a couple of simple steps to get this query into Power BI, we just want to click on the little Power BI button above where we enter the query, this will allow us to download the configuration for an M-language query we can use directly in Power BI desktop.

Azure Log Analytics – Power BI Export
The instructions are included in this file, so I’ll just repeat them here:
The exported Power Query Formula Language (M Language) can be used with Power Query in Exceland Power BI Desktop.
For Power BI Desktop follow the instructions below:
1) Download Power BI Desktop from https://powerbi.microsoft.com/desktop/
2) In Power BI Desktop select: ‘Get Data’ -> ‘Blank Query’->’Advanced Query Editor’
3) Paste the M Language script into the Advanced Query Editor and select ‘Done’
2. From Power BI Desktop, query the user’s account to gain attributes
To get our user information form Azure Active Directory we’re going to query the Microsoft graph, you can just enter the following into the Advanced Query Editor same as above:
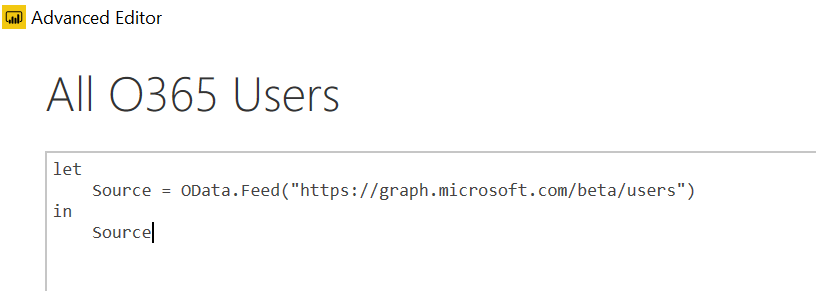
Power BI Advanced Editor
Note, you’ll need to authenticate with a Global Admin account for this to work
3. Create relationships between these datasets in Power BI, based on UPN
In the home screen of Power BI desktop, select “Manage Relationships”
Select “New”, and select to use both your new Azure Log Analytics query and the Azure AD User query and match on UserId and UserPrincipalName from the respective queries
4. Visualise the data
There’s no strict formula here, think about what questions to ask, play around a bit to find ways to show meaningful data, use visual and page level filters
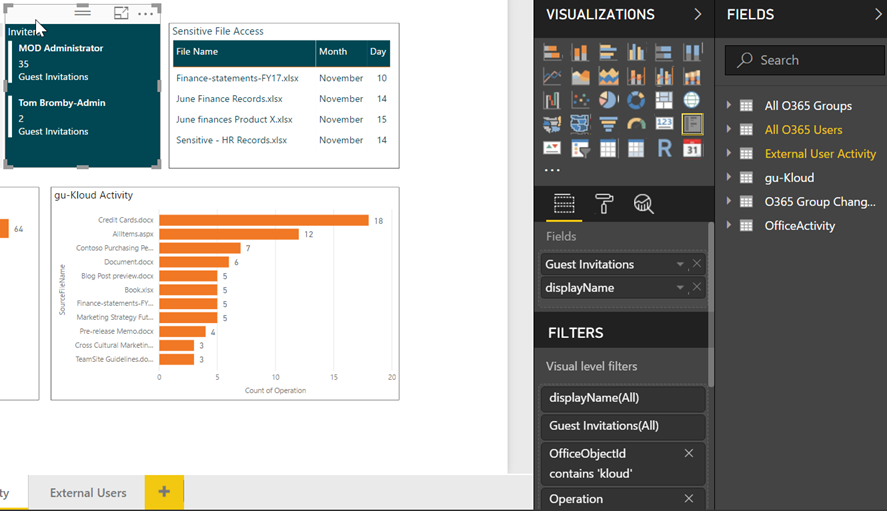
Power BI Desktop
5. Publish to Power BI Online for consumption
When you’re happy with your report, click on the “Publish’ button in Power BI Desktop, and select an appropriate workspace in Power BI Web to publish the report to. Once it’s in Power BI Web, you can then create your dashboard.
To add pages of the report to the dashboard, open the page you want to select, and use the “pin live page” option at the top of the screen. Add the pages of the report you want to the same dashboard, this is the one I built reasonably quickly from our demo tenant:
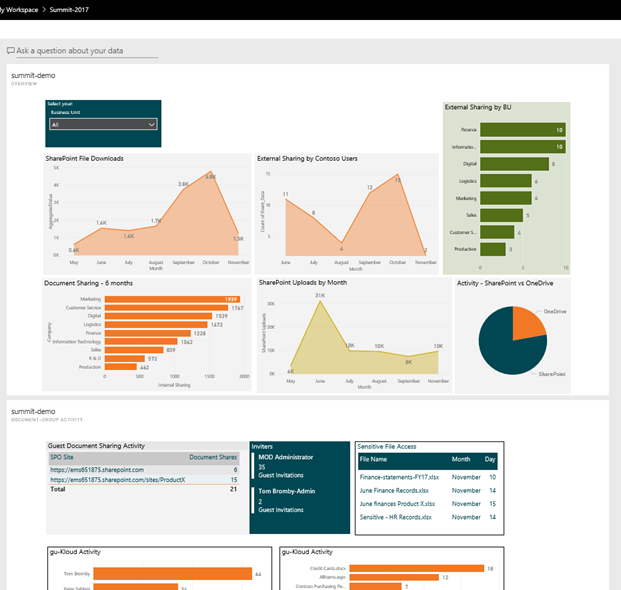
Power BI Dashboard
Good luck, and happy reporting!
