Azure Queues provides an easy queuing system for cloud-based applications. Queues allow for loose coupling between application components, and applications that use queues can take advantage of features like peek-locking and multiple retry attempts to enable application resiliency and high availability. Additionally, when Azure Queues are used with Azure Functions or Azure WebJobs, the built-in poison queue support allows for messages that repeatedly fail processing attempts to be moved to a dedicated queue for later inspection.
An important part of operating a queue-based application is monitoring the length of queues. This can tell you whether the back-end parts of the application are responding, whether they are keeping up with the amount of work they are being given, and whether there are messages that are causing problems. Most applications will have messages being added to and removed from queues as part of their regular operation. Over time, an operations team will begin to understand the normal range for each queue’s length. When a queue goes out of this range, it’s important to be alerted so that corrective action can be taken.
Azure Queues don’t have a built-in queue length monitoring system. Azure Application Insights allows for the collection of large volumes of data from an application, but it does not support monitoring queue lengths with its built-in functionality. In this post, we will create a serverless integration between Azure Queues and Application Insights using an Azure Function. This will allow us to use Application Insights to monitor queue lengths and set up Azure Monitor alert emails if the queue length exceeds a given threshold.
Solution Architecture
There are several ways that Application Insights could be integrated with Azure Queues. In this post we will use Azure Functions. Azure Functions is a serverless platform, allowing for blocks of code to be executed on demand or at regular intervals. We will write an Azure Function to poll the length of a set of queues, and publish these values to Application Insights. Then we will use Application Insights’ built-in analytics and alerting tools to monitor the queue lengths.
Base Application Setup
For this sample, we will use the Azure Portal to create the resources we need. You don’t even need Visual Studio to follow along. I will assume some basic familiarity with Azure.
First, we’ll need an Azure Storage account for our queues. In our sample application, we already have a storage account with two queues to monitor:
- processorders: this is a queue that an API publishes to, and a back-end WebJob reads from the queue and processes its items. The queue contains orders that need to be processed.
- processorders-poison: this is a queue that WebJobs has created automatically. Any messages that cannot be processed by the WebJob (by default after five attempts) will be moved into this queue for manual handling.
Next, we will create an Azure Functions app. When we create this through the Azure Portal, the portal helpfully asks if we want to create an Azure Storage account to store diagnostic logs and other metadata. We will choose to use our existing storage account, but if you prefer, you can have a different storage account than the one your queues are in. Additionally, the portal offers to create an Application Insights account. We will accept this, but you can create it separately later if you want.
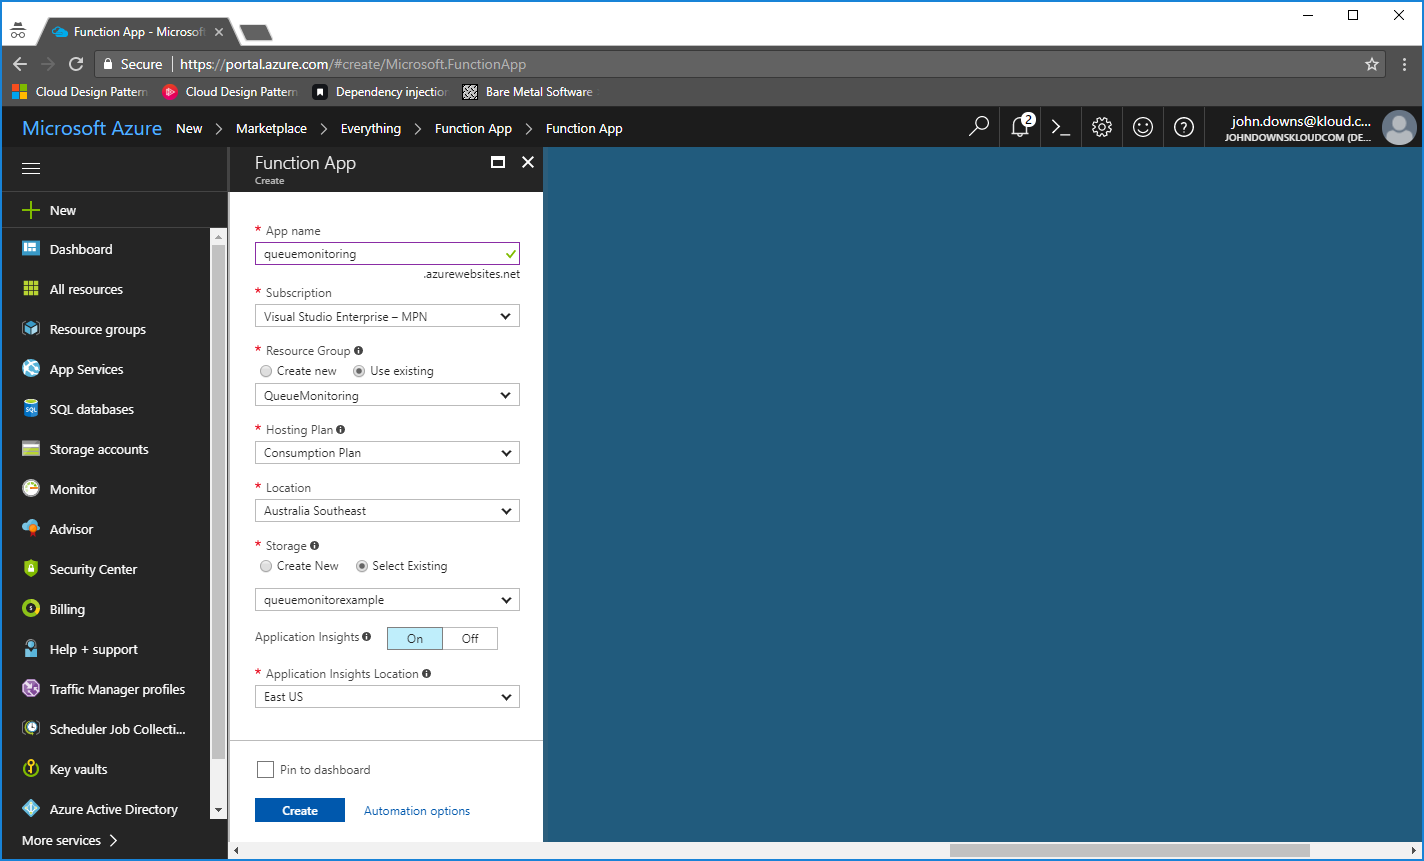
Once all of these components have been deployed, we are ready to write our function.
Azure Function
Now we can write an Azure Function to connect to the queues and check their length.
Open the Azure Functions account and click the + button next to the Functions menu. Select a Timer trigger. We will use C# for this example. Click the Create this function button.
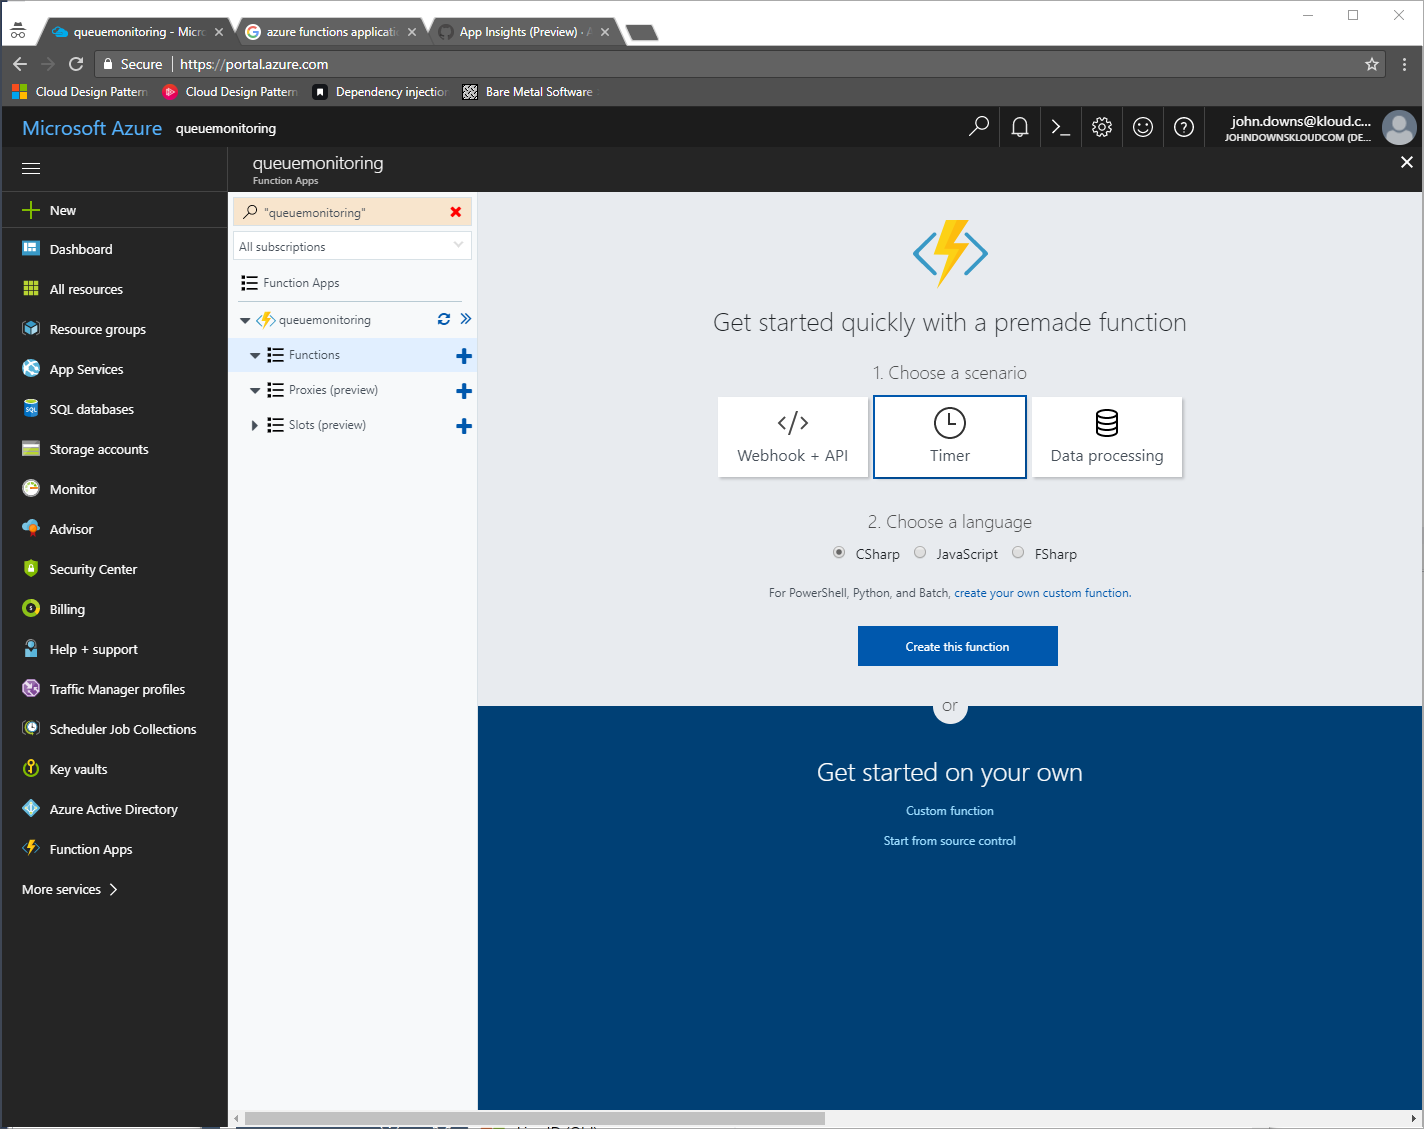
By default, the function will run every five minutes. That might be sufficient for many applications. If you need to run the function on a different frequency, you can edit the schedule element in the function.json file and specify a cron expression.
Next, paste the following code over the top of the existing function:
This code connects to an Azure Storage account and retrieves the length of each queue specified. The key parts here are:
[sourcecode language=”csharp” wraplines=”true” collapse=”false” gutter=”false”]
var connectionString = System.Configuration.ConfigurationManager.AppSettings["AzureWebJobsStorage"];
[/sourcecode]
Azure Functions has an application setting called AzureWebJobsStorage. By default this refers to the storage account created when we provisioned the functions app. If you wanted to monitor a queue in another account, you could reference the storage account connection string here.
[sourcecode language=”csharp” wraplines=”true” collapse=”false” gutter=”false”]
var queue = queueClient.GetQueueReference(queueName);
queue.FetchAttributes();
var length = queue.ApproximateMessageCount;
[/sourcecode]
When you obtain a reference to a queue, you must explicitly fetch the queue attributes in order to read the ApproximateMessageCount. As the name suggests, this count may not be completely accurate, especially in situations where messages are being added and removed at a high rate. For our purposes, an approximate message count is enough for us to monitor.
[sourcecode language=”csharp” wraplines=”true” collapse=”false” gutter=”false”]
log.Info($"{queueName}: {length}");
[/sourcecode]
For now, this line will let us view the length of the queues within the Azure Functions log window. Later, we will switch this out to log to Application Insights instead.
Click Save and run. You should see something like the following appear in the log output window below the code editor:
2017-09-07T00:35:00.028 Function started (Id=57547b15-4c3e-42e7-a1de-1240fdf57b36)
2017-09-07T00:35:00.028 C# Timer trigger function executed at: 9/7/2017 12:35:00 AM
2017-09-07T00:35:00.028 processorders: 1
2017-09-07T00:35:00.028 processorders-poison: 0
2017-09-07T00:35:00.028 Function completed (Success, Id=57547b15-4c3e-42e7-a1de-1240fdf57b36, Duration=9ms)
Now we have our function polling the queue lengths. The next step is to publish these into Application Insights.
Integrating into Azure Functions
Azure Functions has integration with Appliation Insights for logging of each function execution. In this case, we want to save our own custom metrics, which is not currently supported by the built-in integration. Thankfully, integrating the full Application Insights SDK into our function is very easy.
First, we need to add a project.json file to our function app. To do this, click the View files tab on the right pane of the function app. Then click the + Add button, and name your new file project.json. Paste in the following:
This adds a NuGet reference to the Microsoft.ApplicationInsights package, which allows us to use the full SDK from our function.
Next, we need to update our function so that it writes the queue length to Application Insights. Click on the run.csx file on the right-hand pane, and replace the current function code with the following:
The key new parts that we have just added are:
[sourcecode language=”csharp” wraplines=”true” collapse=”false” gutter=”false”]
private static string key = TelemetryConfiguration.Active.InstrumentationKey = System.Environment.GetEnvironmentVariable("APPINSIGHTS_INSTRUMENTATIONKEY", EnvironmentVariableTarget.Process);
private static TelemetryClient telemetry = new TelemetryClient() { InstrumentationKey = key };
[/sourcecode]
This sets up an Application Insights TelemetryClient instance that we can use to publish our metrics. Note that in order for Application Insights to route the metrics to the right place, it needs an instrumentation key. Azure Functions’ built-in integration with Application Insights means that we can simply reference the instrumentation key it has set up for us. If you did not set up Application Insights at the same time as the function app, you can configure this separately and set your instrumentation key here.
Now we can publish our custom metrics into Application Insights. Note that Application Insights has several different types of custom diagnostics that can be tracked. In this case, we use metrics since they provide the ability to track numerical values over time, and set up alerts as appropriate. We have added the following line to our foreach loop, which publishes the queue length into Application Insights.
[sourcecode language=”csharp” wraplines=”true” collapse=”false” gutter=”false”]
telemetry.TrackMetric($"Queue length – {queueName}", (double)length);
[/sourcecode]
Click Save and run. Once the function executes successfully, wait a few minutes before continuing with the next step – Application Insights takes a little time (usually less than five minutes) to ingest new data.
Exploring Metrics in Application Insights
In the Azure Portal, open your Application Insights account and click Metrics Explorer in the menu. Then click the + Add chart button, and expand the Custom metric collection. You should see the new queue length metrics listed.
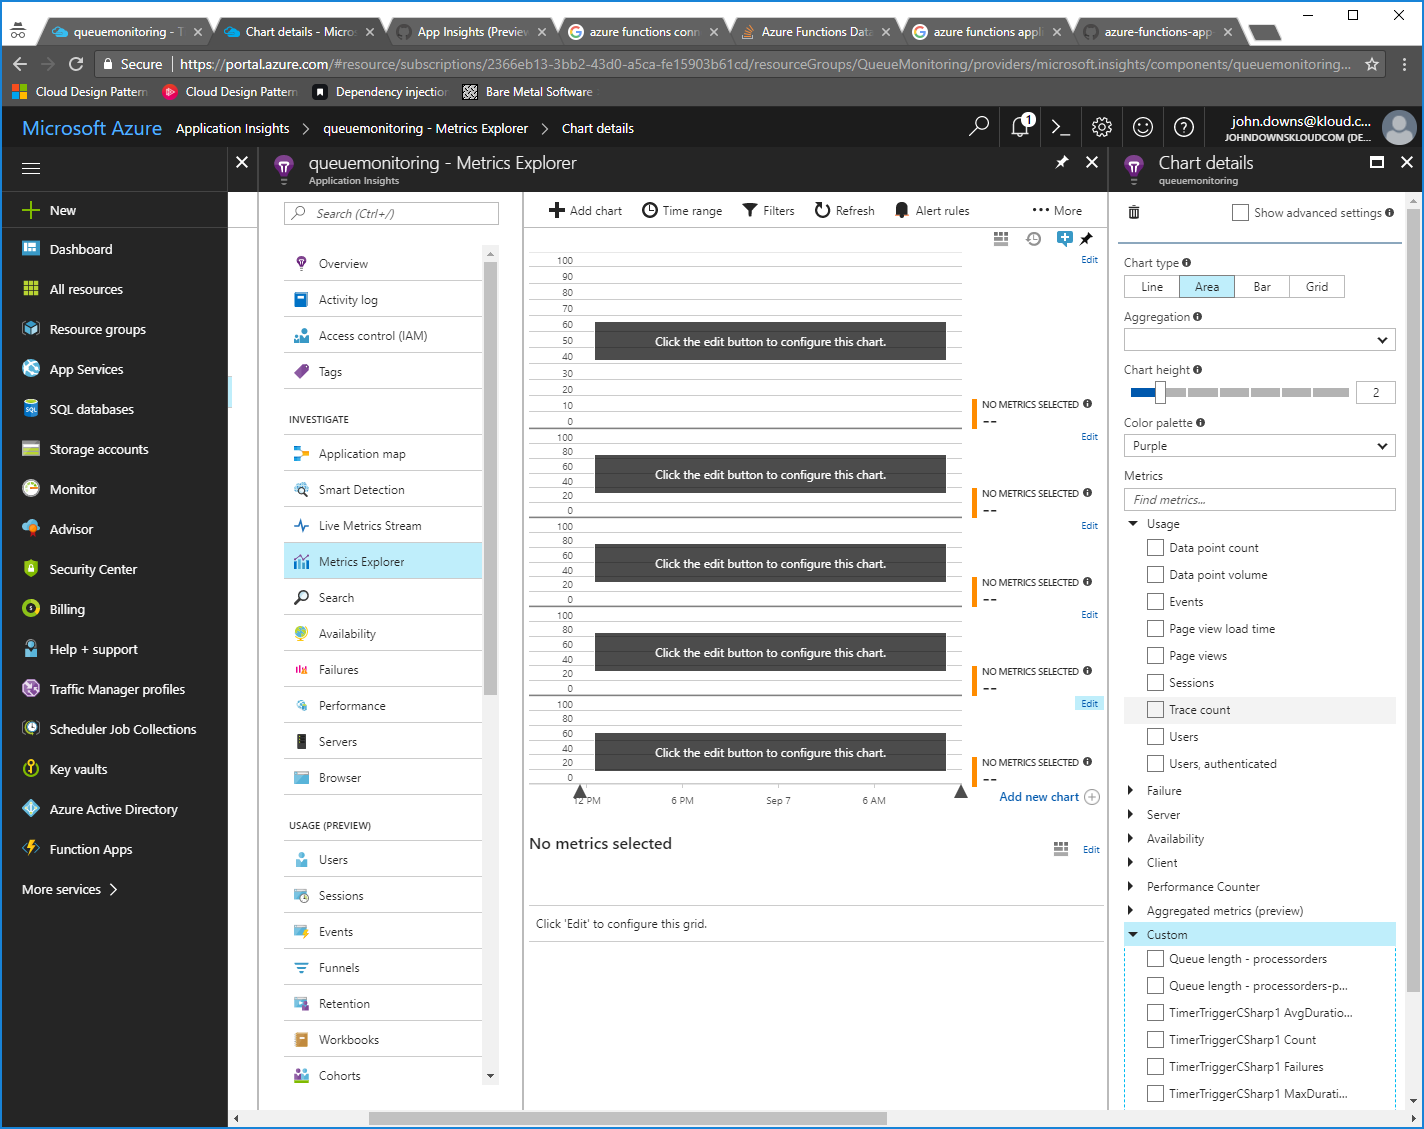
Select the metrics, and as you do, notice that a new chart is added to the main panel showing the queue length count. In our case, we can see the processorders queue count fluctuate between one and five messages, while the processorders-poison queue stays empty. Set the Aggregation property to Max to better see how the queue fluctuates.
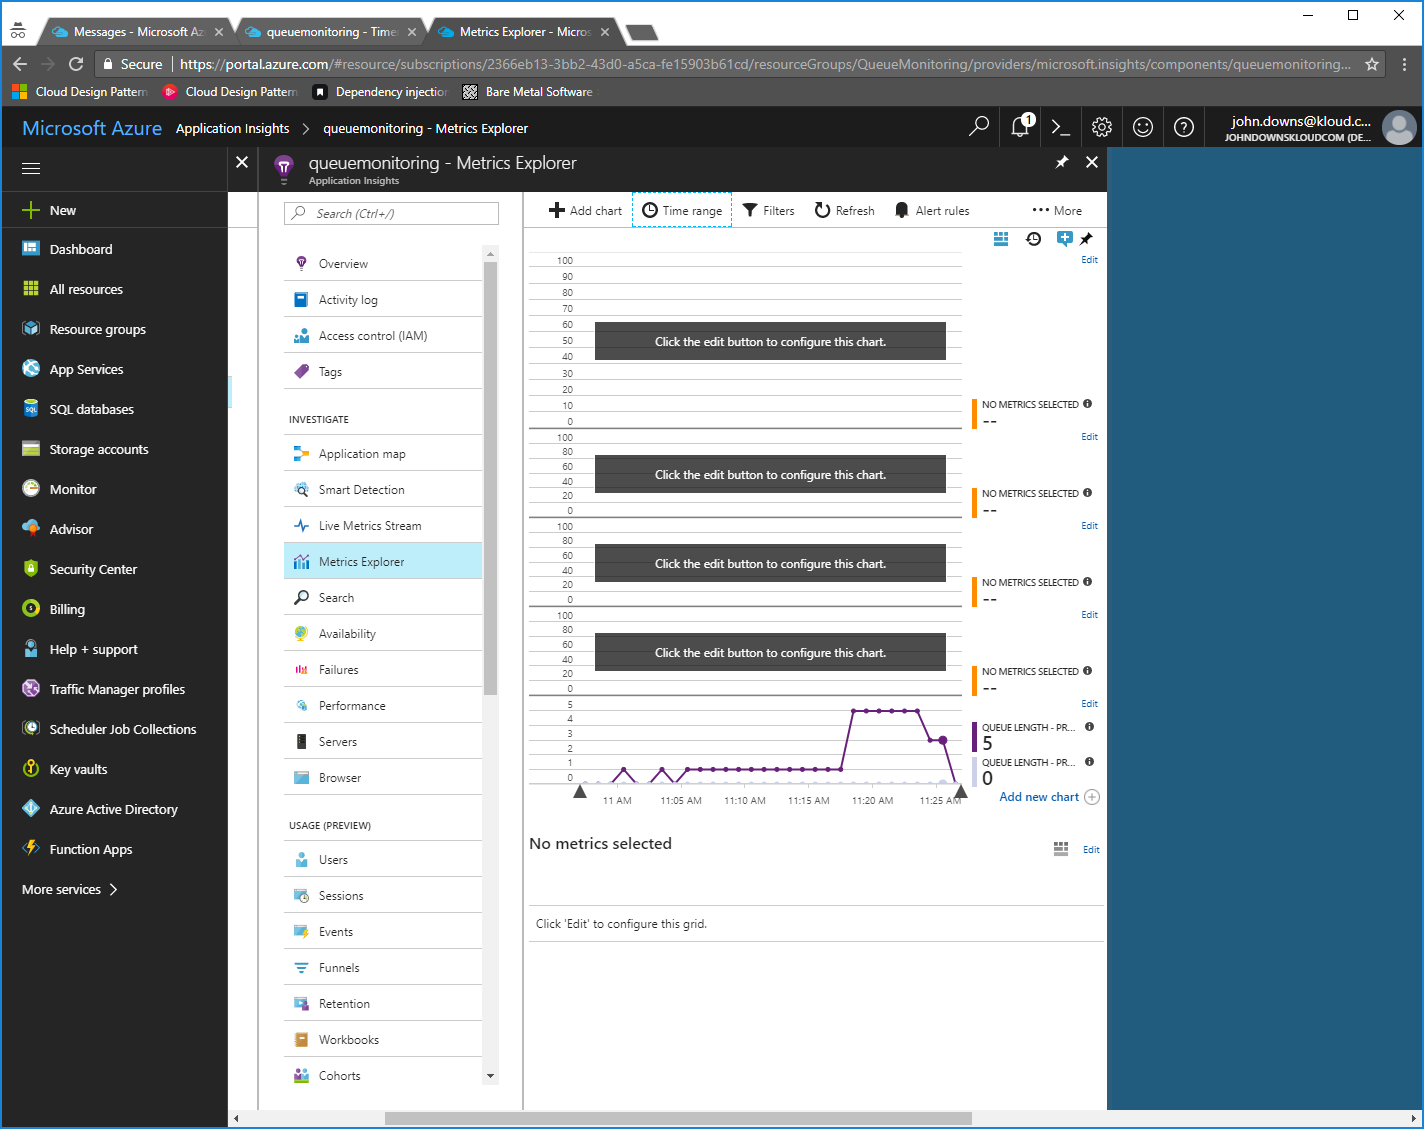
You may also want to click the Time range button in the main panel, and set it to Last 30 minutes, to fully see how the queue length changes during your testing.
Setting up Alerts
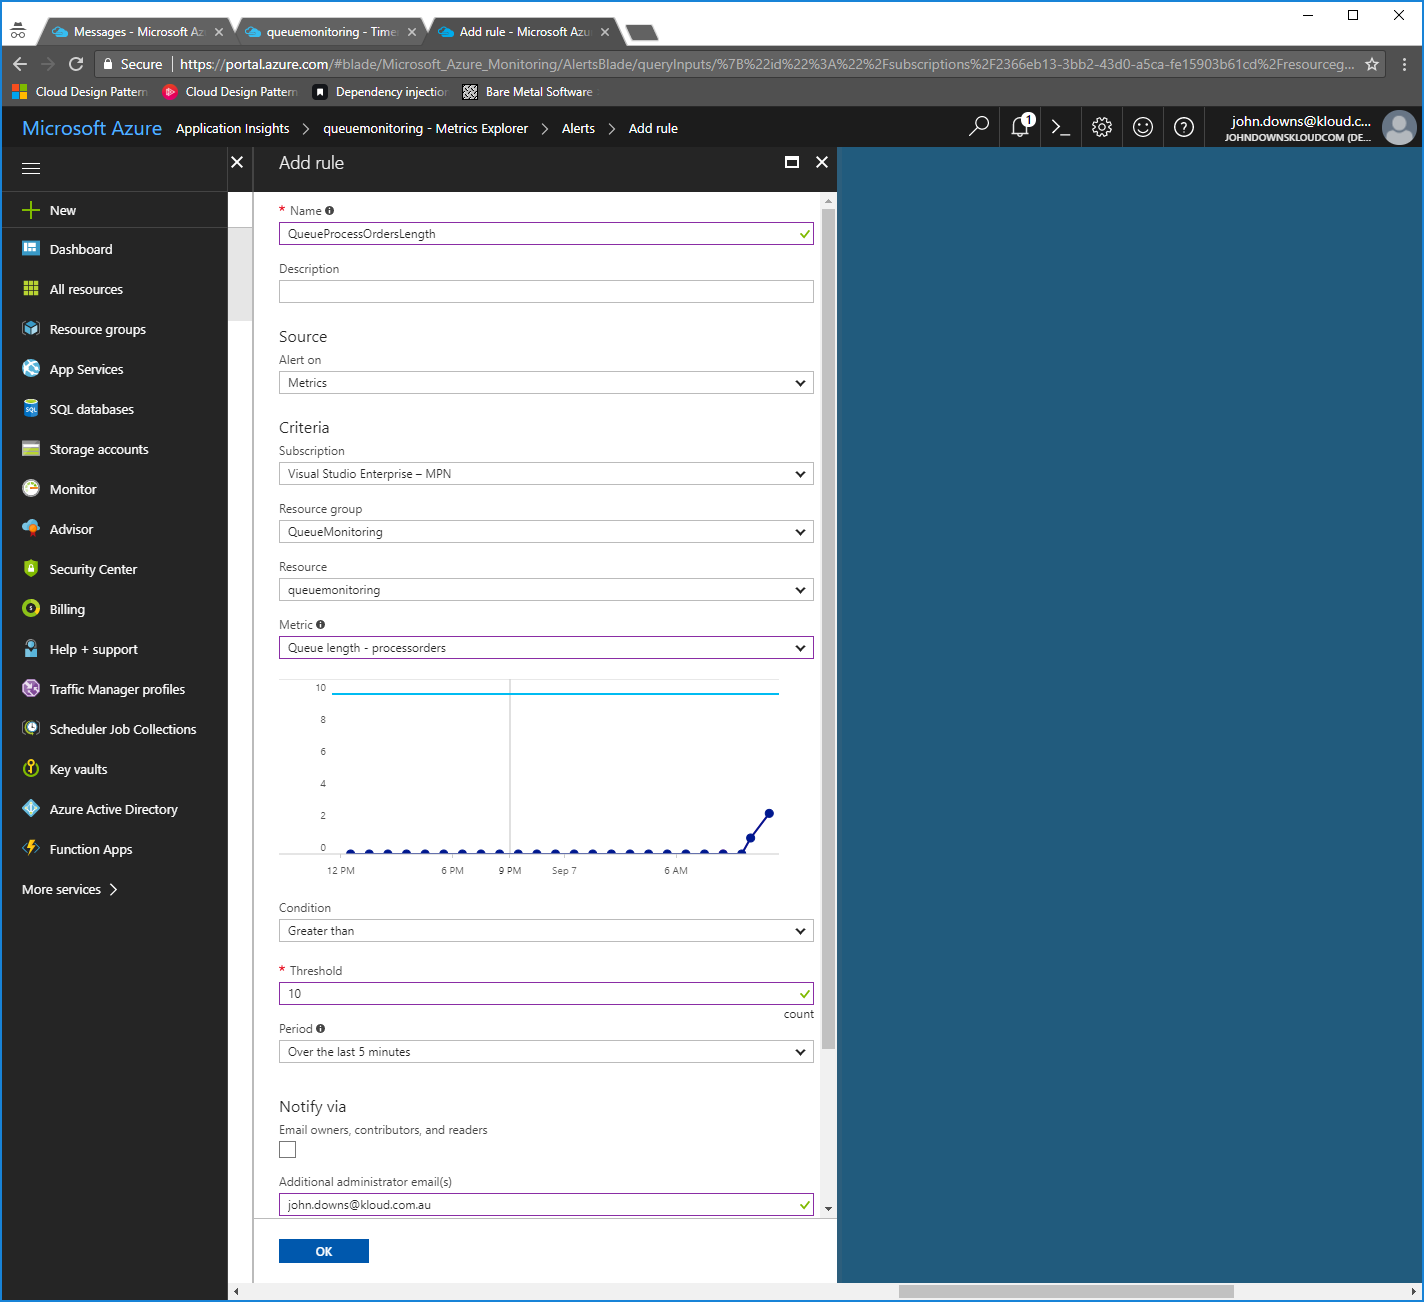
Now that we can see our metrics appearing in Application Insights, we can set up alerts to notify us whenever a queue exceeds some length we specify. For our processorders queue, this might be 10 messages – we know from our operations history that if we have more than ten messages waiting to be processed, our WebJob isn’t processing them fast enough. For our processorders-poison queue, though, we never want to have any messages appear in this queue, so we can have an alert if more than zero messages are on the queue. Your thresholds may differ for your application, depending on your requirements.
Click the Alert rules button in the main panel. Azure Monitor opens. Click the + Add metric alert button. (You may need to select the Application Insights account in the Resource drop-down list if this is disabled.)
On the Add rule pane, set the values as follows:
- Name: Use a descriptive name here, such as `QueueProcessOrdersLength`.
- Metric: Select the appropriate `Queue length – queuename` metric.
- Condition: Set this to the value and time period you require. In our case, I have set the rule to `Greater than 10 over the last 5 minutes`.
- Notify via: Specify how you want to be notified of the alert. Azure Monitor can send emails, call a webhook URL, or even start a Logic App. In our case, I have opted to receive an email.
Click OK to save the rule.
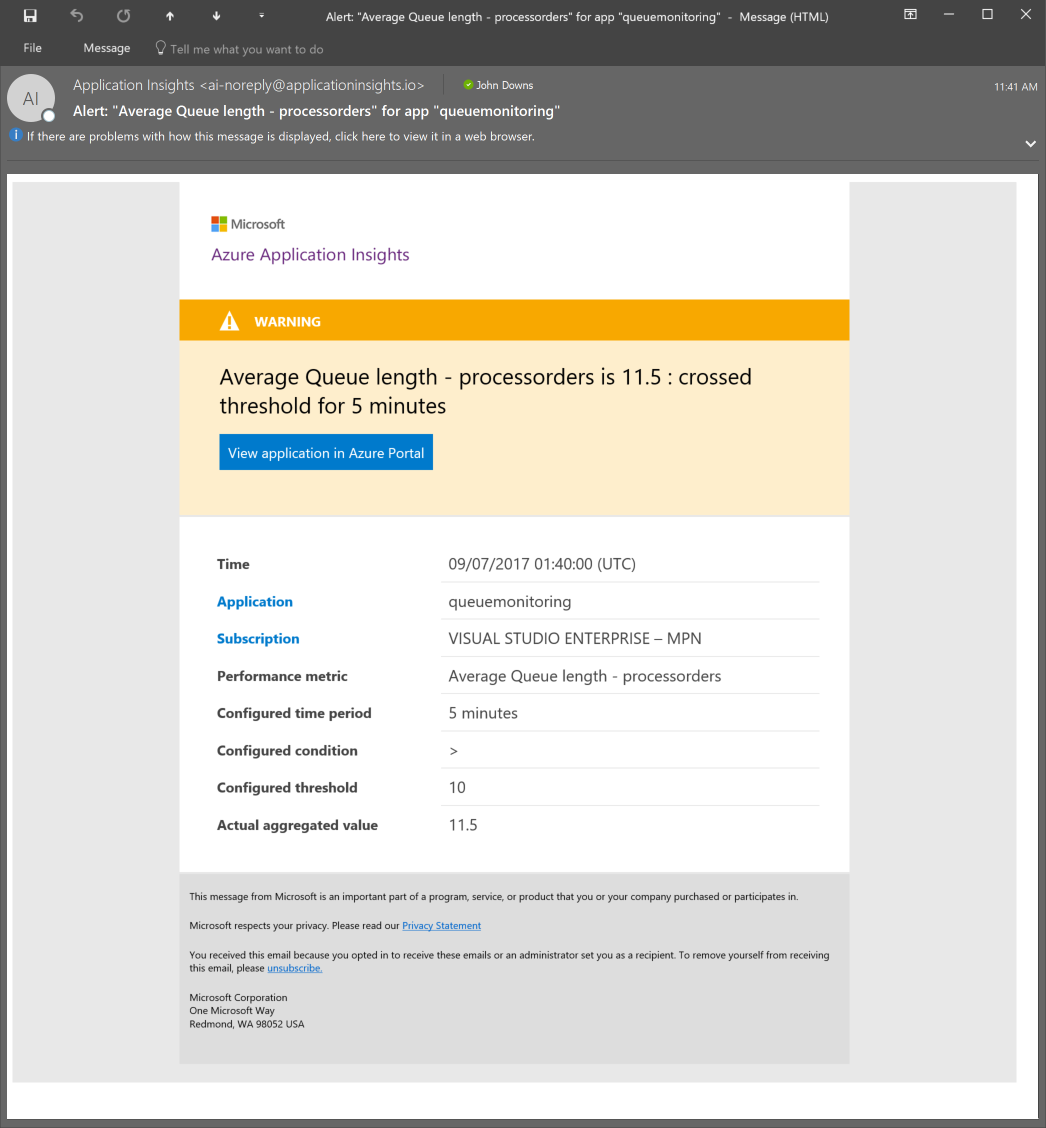
If the queue count exceeds your specified limit, you will receive an email shortly afterwards with details:
Summary
Monitoring the length of your queues is a critical part of operating a modern application, and getting alerted when a queue is becoming excessively long can help to identify application failures early, and thereby avoid downtime and SLA violations. Even though Azure Storage doesn’t provide a built-in monitoring mechanism, one can easily be created using Azure Functions, Application Insights, and Azure Monitor.

Interesting, great post John. I wonder if the webhook alerts can be used with popular operations and incident platforms (e.g. ServiceNow) to create incidents when the queue thresholds are passed.
… I looked it up, it seems yes, this article describes how: https://community.servicenow.com/community/blogs/blog/2016/06/01/how-to-integrate-webhooks-into-servicenow
Yes indeed. And there’s documentation here about how those webhooks work from the Azure Monitor side, including their payload schema: https://docs.microsoft.com/en-us/azure/monitoring-and-diagnostics/insights-webhooks-alerts
Awesome post! Thank you for putting this up.
Hi there, Thank you for the post. I have implemented exactly the way explained here but in my case I see the queue is piled up with more messages and it is stuck. As soon as we stopped the azure functions, it processed all messages from the queue. We were polling at every sec to get the stats but then changed to every minute. Is that too frequent for the queue to block it that actual process cannot access the queue. Any guidance to increase the performance of this function and the Azure Queue performance itself would be much appreciated.
Hi Jeeva, sorry to hear about the issues you’re having.
Polling the queue properties for the approximate message count should not block messages from being processed. This is a ‘read-only’ operation, and the fact that the message count is approximate is designed to allow for the fact that there may be multiple asynchronous operations happening at once.
However, one thing that I have been meaning to update the post with is that, as of few weeks ago, Azure Storage now publishes metrics directly to Azure Monitor! This means you shouldn’t need to have this function anymore in order to monitor queue lengths. If there is some underlying issue here then this should hopefully work around it. I haven’t tested this out yet, but here’s some documentation that might help: https://docs.microsoft.com/en-us/azure/storage/common/storage-metrics-in-azure-monitor. I’ll try to either update this post, or publish a new post, at some point soon with more information.
I hope this helps.
Hi John,
I checked the Metrices Preview with storage account support. As you mention, it does have a QueueMessageCount metric – but it’s for the entire storage account – not split up by queue? Only having the aggregate measures of all the queues in the storage account is not very useful for application-level monitoring. Did I miss something? Do you know if there’s anything planned to expand on this?
Hi @simonwh,
Thanks for your reply – sorry it’s taken me a few days to get to it. I just looked into this a bit more and you’re right. Unfortunately the new monitoring features don’t allow you to monitor individual queues – so for now, an approach like the one in the article seems to be the best (and maybe only) option for this.
Thanks,
John
Hello,
I have used the same methodology and its a success. Now Azure has come up with new runtime version of 2.0.12275.0 (~2). Most of the functions are not compatible with the newer version. We are planning on moving to newer version soon for the same storage queue monitoring. Could you please help me with the same ?
Thanks