Some things I learned recently whilst troubleshooting a customer’s network security group (NSG) configuration.
Default rules
The default configuration of all NSGs includes 3 inbound and outbound rules which is something to be aware of. You can vizualise these rules in the Azure portal or with the following PowerShell. The default rules cannot be disabled but can be overridden by creating rules with a lower priority (read higher number!).
Choose a resource group
[code language=”powershell”]
$nsgName = ‘<NSGNAME>’
$rgName = (Get-AzureRmResourceGroup | Out-GridView -Title ‘Select Azure Resource Group:’ -PassThru).ResourceGroupName
[/code]
Display default rules
[code language=”powershell”]
(Get-AzureRmNetworkSecurityGroup -Name $nsgName -ResourceGroupName $rgName).DefaultSecurityRules | Select-Object * | Out-GridView
[/code]
Display custom rules
[code language=”powershell”]
(Get-AzureRmNetworkSecurityGroup -Name $nsgName -ResourceGroupName $rgName).SecurityRules | Select-Object * | Out-GridView
[/code]

NSG default rule set.
By default no inbound traffic is allowed except for requests from any Azure load balancers which may have been provisioned. Traffic across the subnet is allowed as is some outbound traffic including to the internet. So it’s important to use caution when considering the application of additional DENY ALL rules to the existing configuration.
ASM v ARM
As discussed previously there are two operating modes in Azure, Service Management (ASM) and Resource Manager (ARM) with NSG behaviour differing across the two, so it’s important to be aware of the differences here too.
In ASM NSGs can be applied at the virtual machine as well as the network interface and subnet level. In ARM NSG can only be applied at the subnet and network interface level. However diagnostic logging of NSG events is available in ARM but not in ASM.
VPN and Express Route Gateways
Applying Network Security Groups to VPN and Express Route Gateways is strongly recommended against.
NSG diagnostic logging
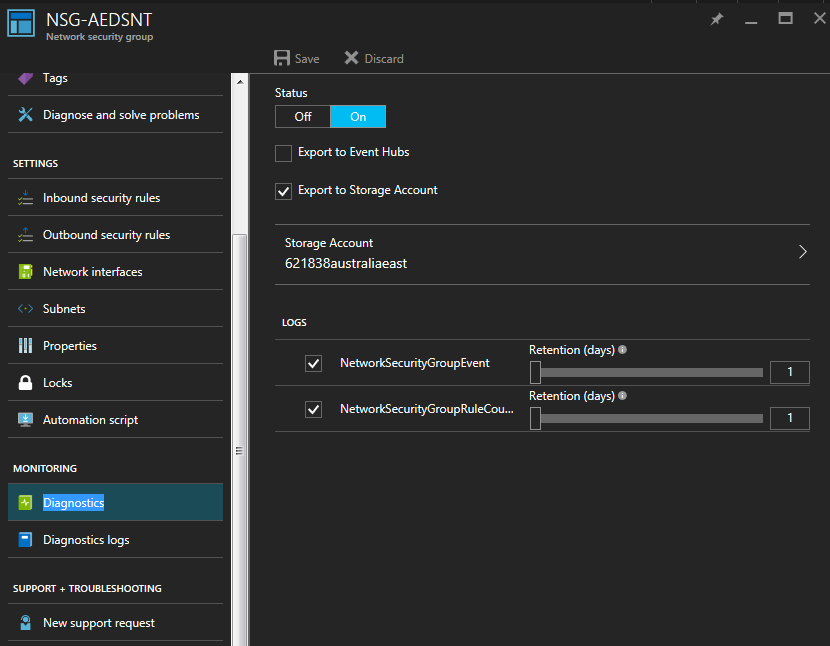
Packet trace functionality may not be available for troubleshooting NSGs at this time but diagnostic logging can be used to better understand the nature of any problems your configuration might be suffering. In order to enable Network Security Group logging browse to the NSG in the portal and head for the Diagnostics tab. Options include whether to log to a Storage Account or the Events Hub using a Message Bus. You also have a choice of logging retention period, from 0 (indefinite) to 365 days. However existing logs will be lost if you change storage account. And there’s a hard requirement for the storage account you chose to be in the same region as the resource in question.

Enabling Network Security Group diagnostics logging.
Log Types
There are three different kinds of logs available for troubleshooting problems with Network Security Groups: Audit, Event and Counter. Audit logs are enabled by default across all subscriptions, do not require a separate storage account, have a 90 day retention period and can be viewed in the portal. Event logs need to be manually enabled per NSG and can be used to view which rules have been enabled and at what level they been applied. Counter logs also need to be manually enabled per NSG and can be used to see how often a rules was triggered to ALLOW or DENY traffic.
Analysing Logs
The following means are available for analyzing the logs mentioned above:
- PowerShell.
- The Azure CLI.
- REST APIs.
- The portal.
- Power BI.
- Azure Log Analytics.
