My client was reporting performance issues with an existing app that was developed internally, and I had to find the problems. So, here is my journey on finding the issues and resolving them. The resolution was a reduction of the memory usage to 1/4 of what it was and usage was stabilised to this level (1/4). I am hopeful that this blog post can help you too in refining your app and pro-actively resolving any performance issues.
Capturing Telemetry Data
The first step in optimisation must be setting your benchmark, and in order to do that, we need to know where we stand. Thus, I set up an integration with Azure Application Insights to capture all memory warnings, errors, warnings, and battery level monitoring. For details on integrating with Azure App Insights, you can read more in my previous post here. The relevant part for us in this post is capturing memory warnings. There are three ways to capture memory warnings in iOS as I listed them on StackOverflow, we will stick with AppDelegate, as this is applicable to both traditional Xamarin and Xamarin Forms.
[code lang=”csharp”]
public partial class AppDelegate
{
…
public override void ReceiveMemoryWarning (UIApplication application)
{
// this (MemoryWarningsHandler) is a helper that I created
// to capture more info when a memory warning is raised. Things like (nav Stack, running time, etc)
MemoryWarningsHandler.Record ();
}
}
[/code]
Always, Always, listen to these memory warning notifications from the OS, even if you are not actioning them now
In Android, we could also do the same using Application.OnLowMemory (See Android docos) as below:
[code lang=”csharp”]
public class MyApp : Application
{
…
public void OnLowMemory ()
{
MemoryWarningsHandler.Record ();
}
}
[/code]
Once we received and captured these memory warnings on Azure App Insights, we will then know that we have a memory warning, and whoever is looking at the report will keep bugging you until you fix this problem, if the app was not crashing due to low memory 🙂
Investigating Low Memory Issues
Once we identified that there is a problem with Memory, we need to figure out where the problem is occuring. To do this, we could use Xamarin Profiler. At the time of this writing (March 2016), Xamarin Profiler is still in preview and has many known bugs, but it still provides a good starting point.
We can monitor a number of performance indicators using Xamarin Profiler including:
- Memory Allocation
- Dependency Cycles
- CPU Time
- Few more aspects of the app Performance
For this post, we are interested in memory leaks, so we can start a profiler session, by choosing Memory Allocation when the profiler starts. More info on starting a profiler session can be found on Xamarin website.
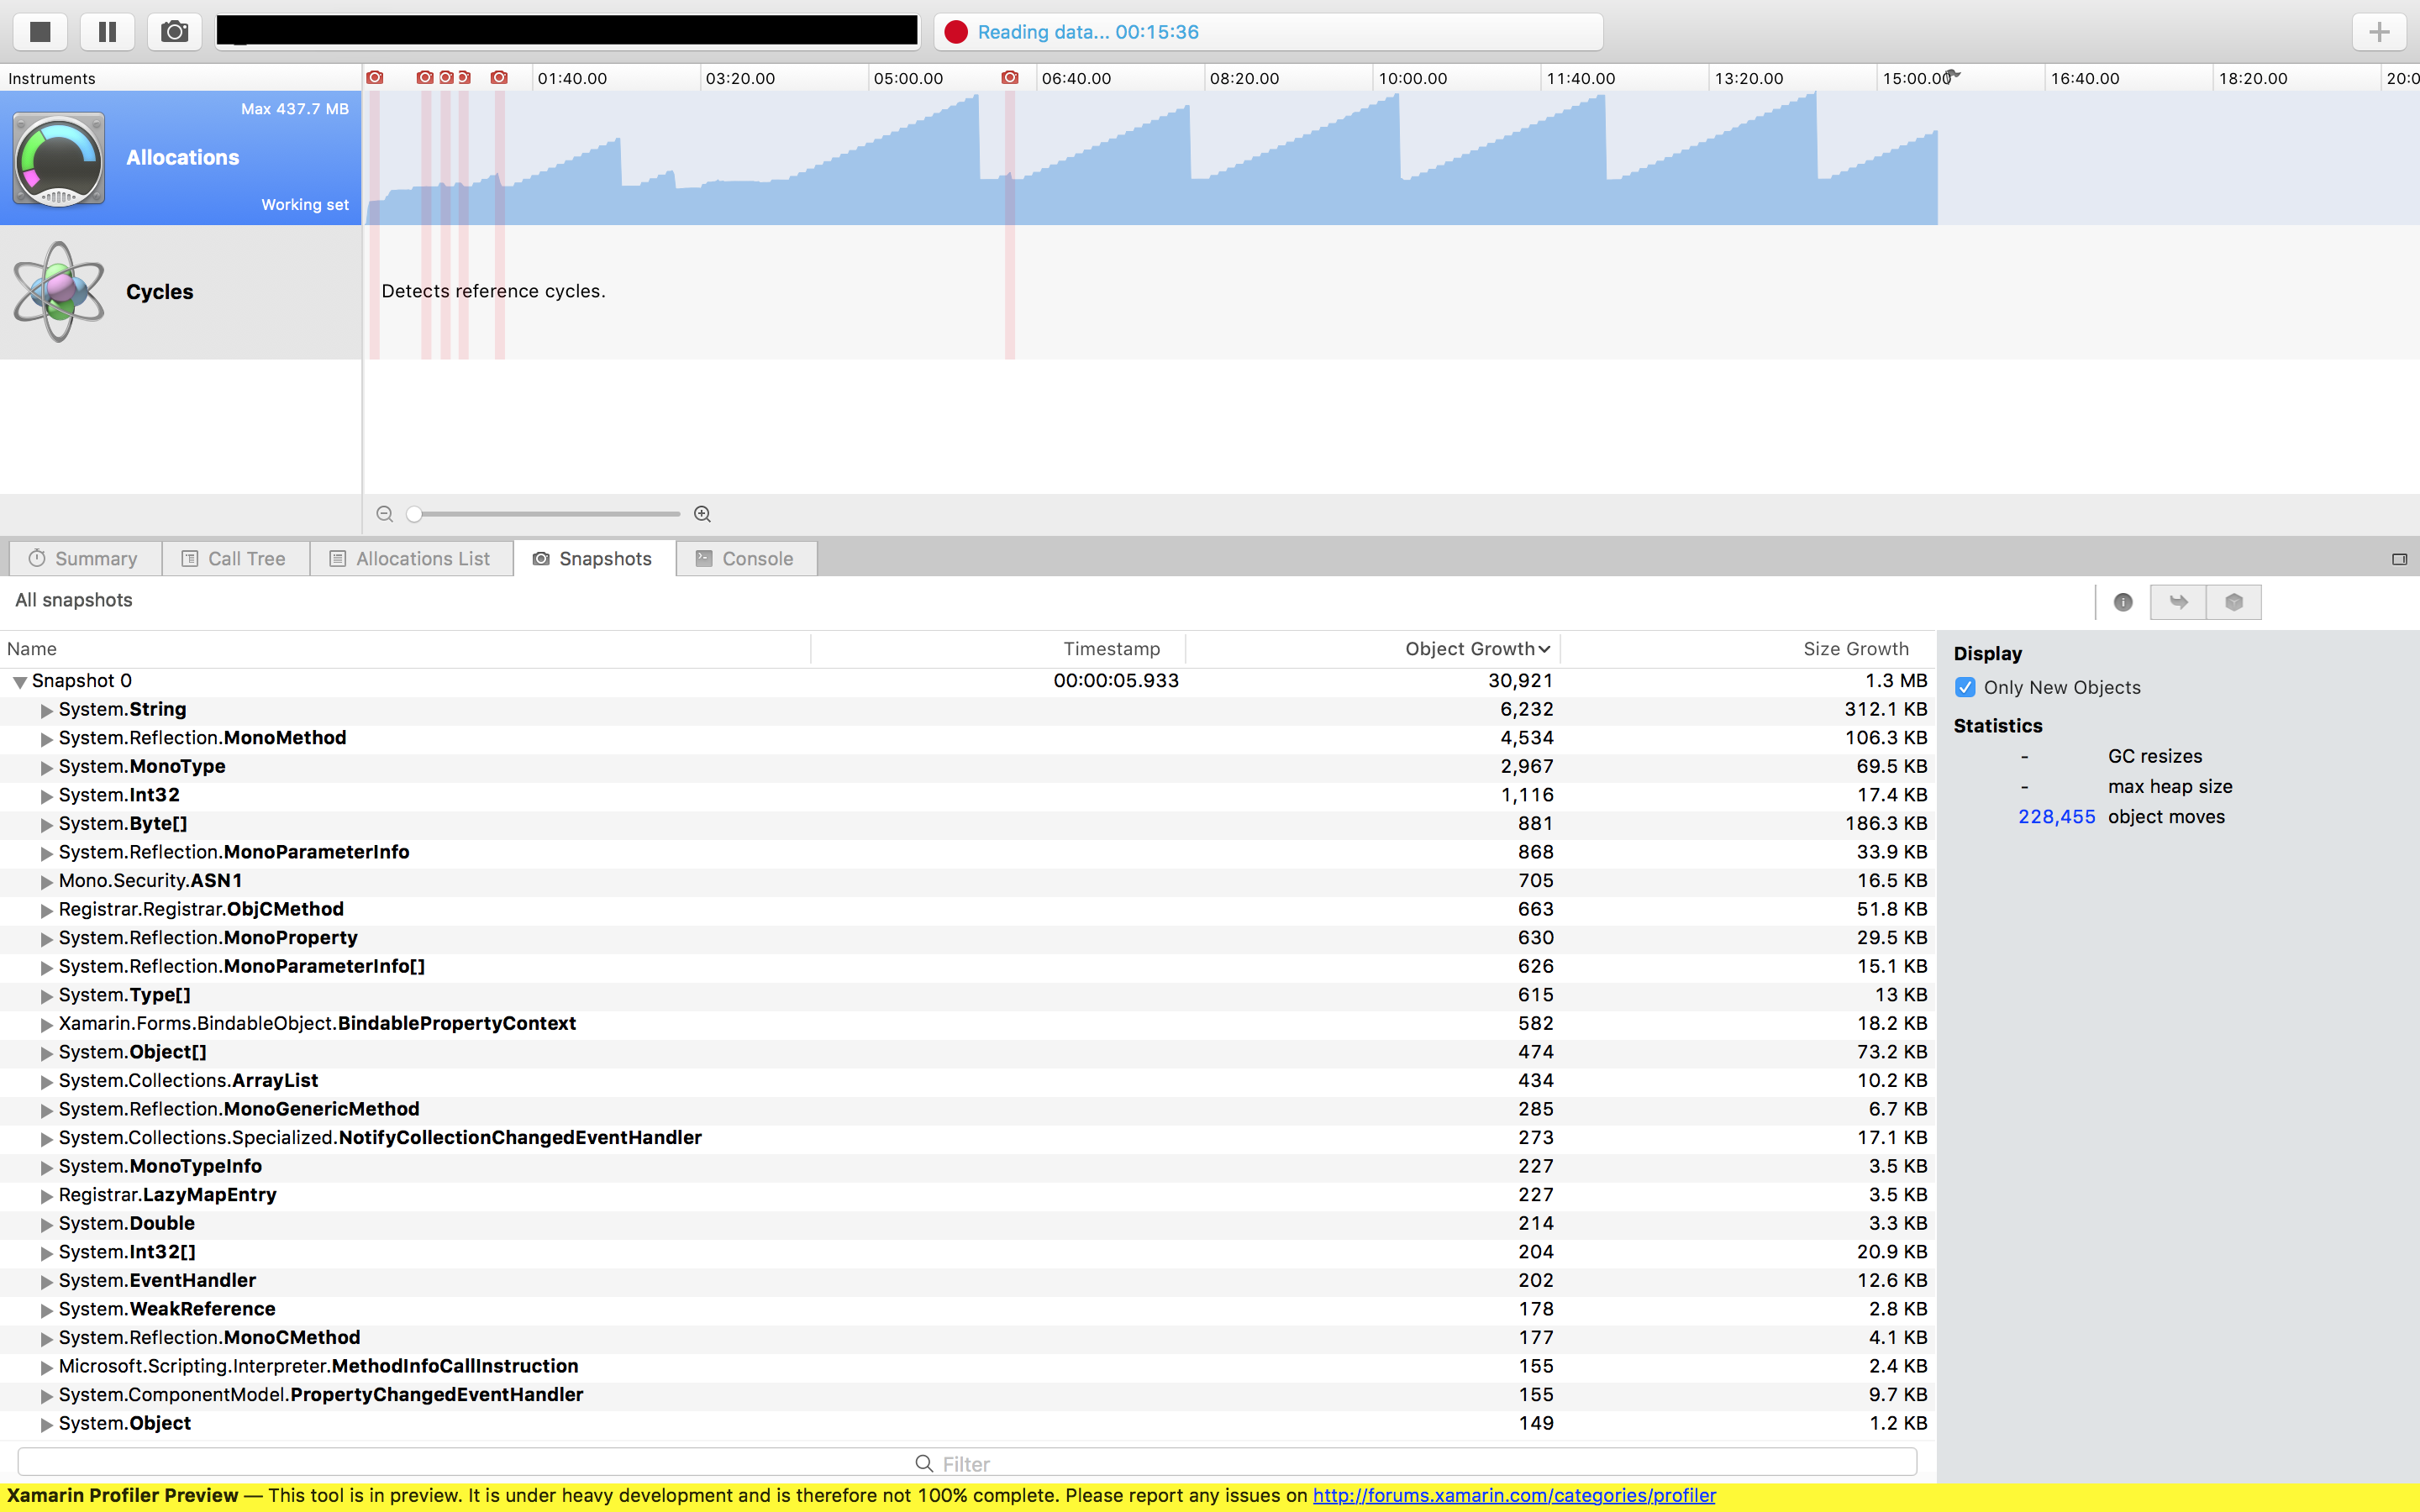
In previous versions of Xamarin Profiler, I was able to view the call tree which gave me a great view on where the issue exactly was. This was based on call stacks and it tells you exactly how much memory is used in every entity/method. Unfortunately, in this version, I could not get this to show me this detailed view, but I was able to capture few memory snapshots and monitor the growth of used memory. My diagram looked like this:
This made it very clear that we have a problem in our memory consumption, the memory usage was racking up to 600 MB in some scenarios. The important part was now finding where the problem is.
Identify Problematic Code
In the absence of the call tree view, I started using the app and monitoring the memory usage. I established that it was a particular Page (Xamarin Forms Page) that was causing the memory usage to grow rapidly. As you can see at the start of the application, things were quite alright. Then, I focused my attention to that page. Looking at the page, it seemed harmless. It’s only a screen-saver-like page for a kiosk app. I could see a couple of small problems, but these are minor and would not cause the memory to grow that quickly. The code of this screen saver page can be seen below:
[code lang=”csharp”]
public class ScreenSaverPage : ContentPage
{
private readonly List<string> _imageSourceList;
private readonly List<FileImageSource> _cacheImageSource = new List<FileImageSource>();
private readonly Image _screenSaver;
private int _currentImageIndex;
private readonly CancellationTokenSource _cts = new CancellationTokenSource();
public ScreenSaverPage()
{
_imageSourceList = new List<string> { "Screensaver1.png", "Screensaver2.png", "Screensaver3.png", "Screensaver4.png" };
// Caching it to Reduce loading from File all the time
foreach (string fileName in _imageSourceList)
_cacheImageSource.Add(new FileImageSource {File = fileName});
_screenSaver = new Image
{
HorizontalOptions = LayoutOptions.FillAndExpand,
VerticalOptions = LayoutOptions.FillAndExpand,
Aspect = Aspect.AspectFill,
Source = _cacheImageSource.FirstOrDefault()
};
var tapGestureRecognizer = new TapGestureRecognizer();
tapGestureRecognizer.Tapped += async (s, e) =>
{
_cts.Cancel();
await Task.Run(async () => await App.ResetInactivity(typeof (BaseViewModel)));
};
Content = _screenSaver;
_screenSaver.GestureRecognizers.Add(tapGestureRecognizer);
// Configure the OnAppearing to kick off the ScreenSaver
Appearing += async (sender, args) =>
{
try
{
await Task.Run(async () =>
{
while (true)
{
if (_cts.IsCancellationRequested)
{
App.Logger.LogInfo("CANCELLED – In the Loop");
break;
}
await Task.Delay(5000, _cts.Token).ContinueWith(async t =>
{
try
{
if (_cts.IsCancellationRequested)
{
App.Logger.LogInfo("CANCELLED – In the Action");
}
else
{
// this is the unnecessary Task
await Task.Run(() =>
{
_currentImageIndex = _currentImageIndex < _imageSourceList.Count 1 ? _currentImageIndex + 1 : 0;
Device.BeginInvokeOnMainThread(
() =>
{
_screenSaver.Source = _cacheImageSource[_currentImageIndex];
});
});
}
}
catch (Exception ex)
{
App.Logger.Log(ex);
throw;
}
}, _cts.Token);
}
});
}
catch (OperationCanceledException e)
{
App.Logger.Log(e);
Device.BeginInvokeOnMainThread(async () =>
{
await Navigation.PopModalAsync();
});
}
};
}
}
[/code]
Now, please do not ask me why it’s done this way, because this is just what I have been given from the existing app. The three problems that stood out to me were:
- Wiring OnAppearing event without unsubscribing.
- GestureRecogniser is added but not removed.
- A Task was being created every 5 sec unnecessarily.
However, these all were small compared to the main problem, and even removing all these together did not help in reducing the memory usage. so I switched off the part that swaps the screensaver images.
[code lang=”csharp”]
_screenSaver.Source = _cacheImageSource[_currentImageIndex];
[/code]
At first, this looked harmless to me, and we were caching the FileImaeSource in a list, so we were not loading the images every time, we only loading them once and only swapping the source on the background image. However, it appeared that this was the root cause. Commenting this line out made the memory usage stay stable below the 200 MB mark, which was great news for me :).
Make sure that you have your benchmark before any optimisations, otherwise you would not know the impact of your changes.
Developing a Solution
To avoid swapping the image source, which by the way, I think it is a Xamarin Forms problem, but I will chase that separately, I started thinking of creating multiple static background images, and only toggle their visiblity. This meant that I would have 4 images loaded and all bound to fill the screen, but I only show (make visibile) one of them at a time. The Page code changed to be like this:
[code lang=”csharp”]
public class ScreenSaverPage : ContentPage
{
private readonly List<string> _imageSourceList = new List<string> { "Screensaver1.png", "Screensaver2.png", "Screensaver3.png", "Screensaver4.png" };
private readonly List<Image> _backgroundImages = new List<Image>();
private RelativeLayout _relativeLayout;
private int _currentImageIndex;
private readonly CancellationTokenSource _cts = new CancellationTokenSource();
public ScreenSaverPage()
{
_relativeLayout = new RelativeLayout { HorizontalOptions = LayoutOptions.FillAndExpand, VerticalOptions = LayoutOptions.FillAndExpand };
LoadImages (_relativeLayout);
_backgroundImages [0].IsVisible = true;
var tapGestureRecognizer = new TapGestureRecognizer();
tapGestureRecognizer.Tapped += async (s, e) =>
{
_cts.Cancel();
await Task.Run(async () => await App.ResetInactivity(typeof (BaseViewModel)));
};
Content = _relativeLayout;
_relativeLayout.GestureRecognizers.Add(tapGestureRecognizer);
}
protected async override void OnAppearing ()
{
base.OnAppearing ();
try
{
await Task.Run(async () =>
{
while (true)
{
if (_cts.IsCancellationRequested)
{
App.Logger.LogInfo("CANCELLED – In the Loop");
break;
}
await Task.Delay(5000, _cts.Token).ContinueWith(async t =>
{
try
{
if (_cts.IsCancellationRequested)
{
App.Logger.LogInfo("CANCELLED – In the Action");
}
else
{
_currentImageIndex = (_currentImageIndex < _imageSourceList.Count -1) ? _currentImageIndex +1 : 0;
Device.BeginInvokeOnMainThread(
() =>
{
SetBackgroundVisibility(_currentImageIndex);
});
}
}
catch (Exception ex)
{
App.Logger.Log(ex);
throw;
}
}, _cts.Token);
}
});
}
catch (OperationCanceledException e)
{
App.Logger.Log(e);
Device.BeginInvokeOnMainThread(async () =>
{
await Navigation.PopModalAsync();
});
}
}
private void LoadImages (RelativeLayout layout)
{
foreach (string fileName in _imageSourceList)
{
var image = CreateImageView (new FileImageSource { File = fileName });
layout.Children.Add (image, Constraint.Constant (0), Constraint.Constant (0), Constraint.RelativeToParent (parent => parent.Width), Constraint.RelativeToParent (parent => parent.Height));
_backgroundImages.Add (image);
}
}
void SetBackgroundVisibility (int currentImageIndex)
{
for (int i = 0; i < _backgroundImages.Count; i++)
{
_backgroundImages [i].IsVisible = i == currentImageIndex;
}
}
private static Image CreateImageView (FileImageSource source)
{
return new Image
{
HorizontalOptions = LayoutOptions.FillAndExpand,
VerticalOptions = LayoutOptions.FillAndExpand,
Aspect = Aspect.AspectFill,
Source = source,
IsVisible = false
};
}
}
[/code]
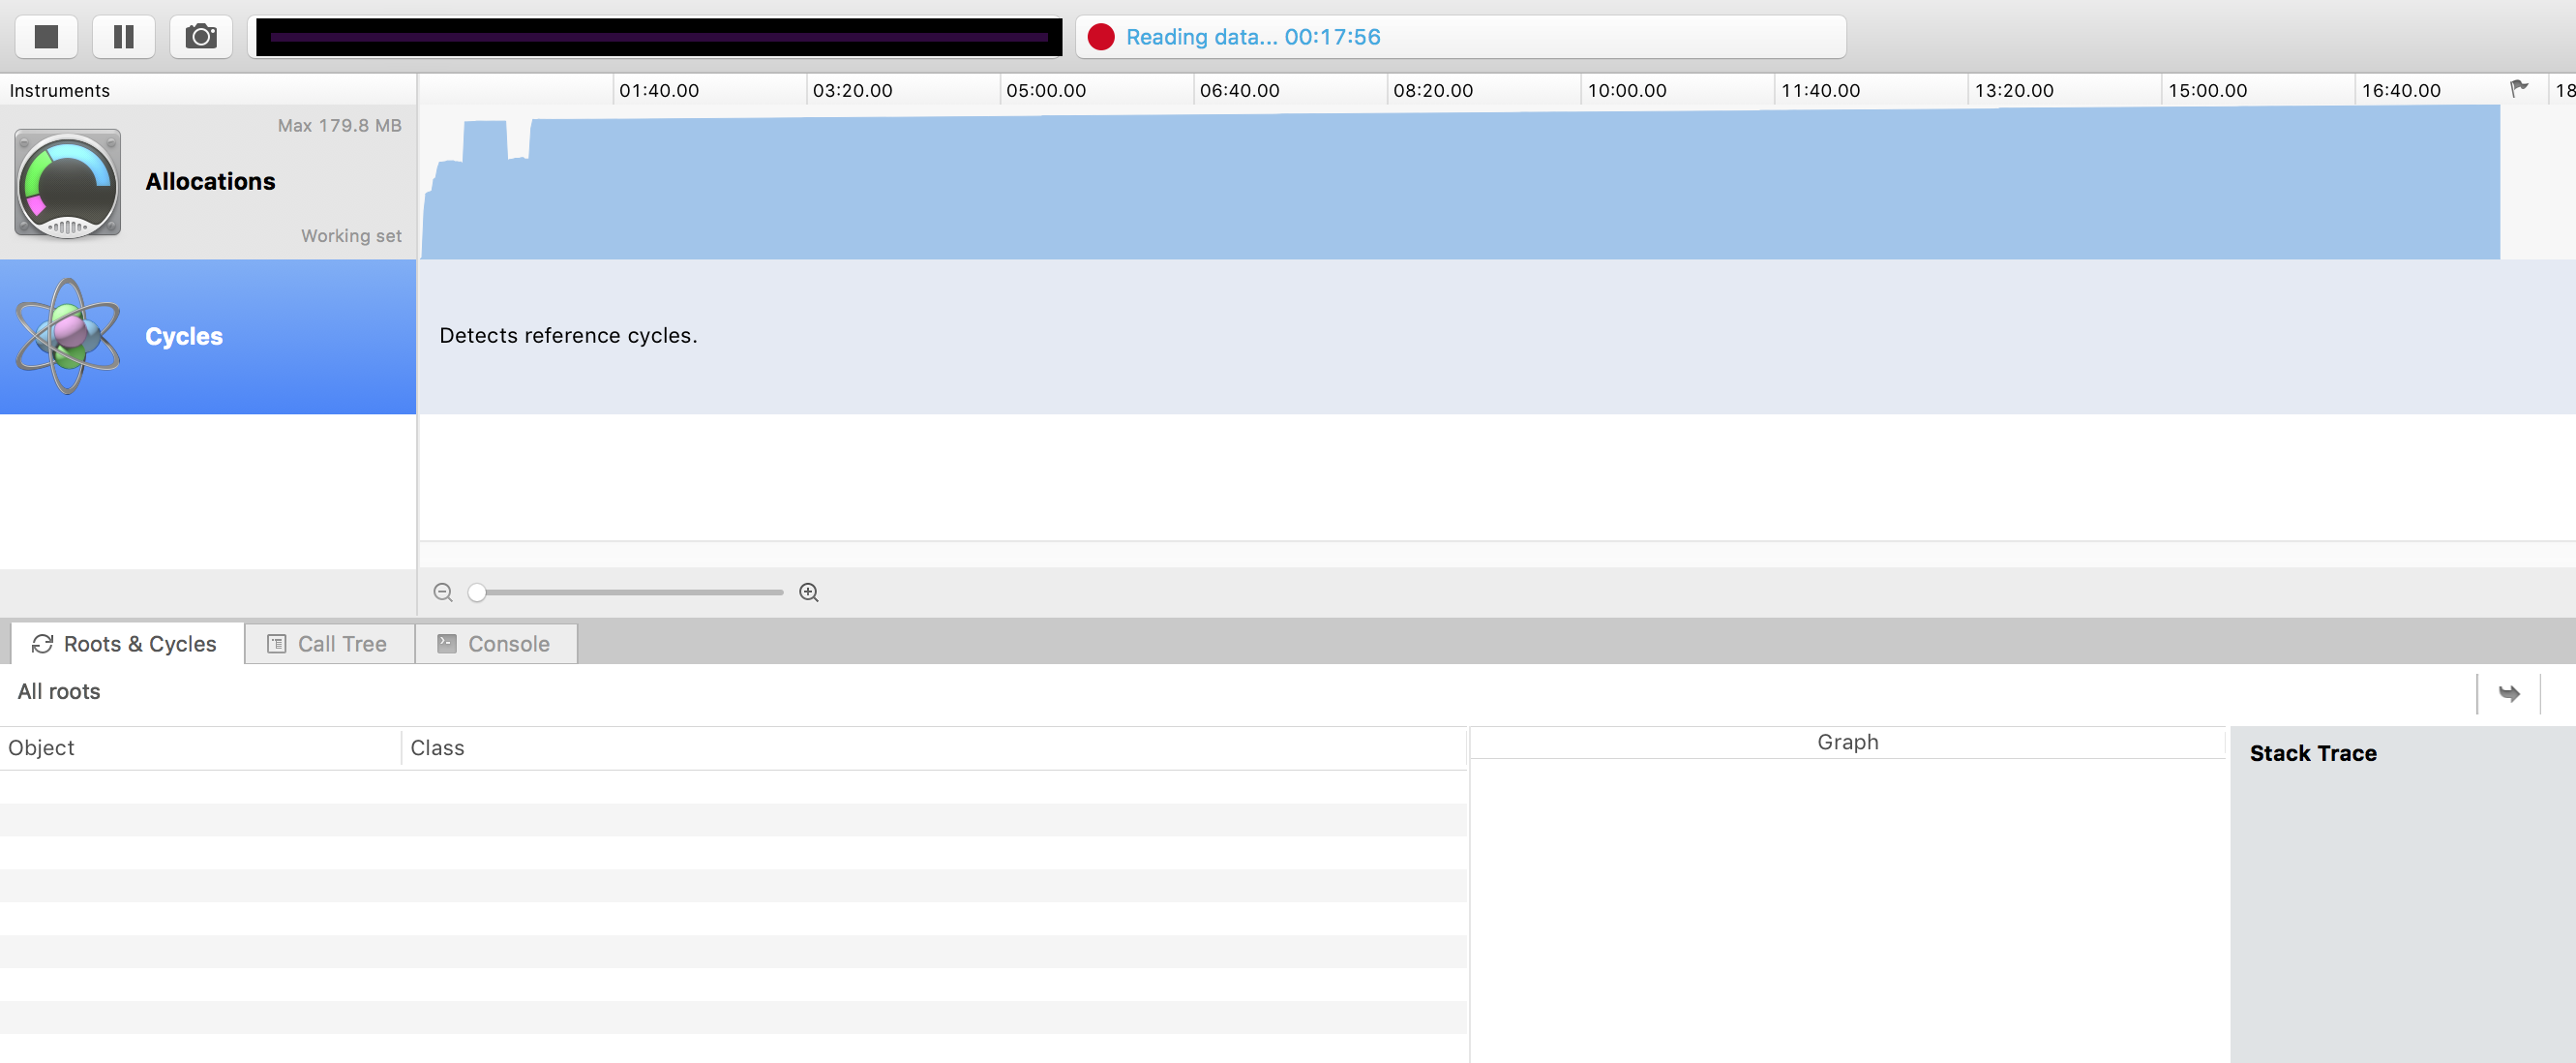
You would agree that this is a big improvement on what we had originally, and it shows clearly on the Xamarin Profiler when we run the app with this new change. The memory plot on the Xamarin profiler was looking like this:
This is a great reduction, and it is less than one third of what the app was using before (~ 600 MB), but I was still thinking that it needs to be optimised further.
Can We Do Better?
The graph above was showing me that the memory usage was still going up, not by much but still growing. Also, when I switch between screens/pages, I noticed that the screensaver page was taking lots of memory to start with (~ 50 MB), which is to create the images and FileSourceImage objects. However, I noticed that when we move away from this page (screen saver), these entities are not being cleared quickly enough by the GC. Thus, I added the following:
[code lang=”csharp”]
public partial class ScreenSaverPage : ContentPage
{
…
protected override void OnDisappearing ()
{
base.OnDisappearing ();
PrepareForDispose ();
}
void PrepareForDispose ()
{
foreach (var image in _backgroundImages)
{
image.Source = null;
}
_backgroundImages.Clear();
_relativeLayout.GestureRecognizers.RemoveAt (0);
_relativeLayout = null;
_cts.Dispose ();
Content = null;
}
}
[/code]
This helped dispose of the images and the gesture recogniser quickly enough and helped me keep the memory usage at around 130 – 160 Mb, which is a great result considering that we started with 600 MB. The other pleasing part is that memory usage was very stable and no major peak were found. It fluctuates slightly when you move between pages, which is perfectly normal but it goes back to a steady level around 130 – 160 MB.
I hope you find this useful and please do check your Xamarin apps before you release or whenever you get the time, as these things are hard to see but they could bite you when you go to prod 🙂


Thank you for this article. Using Azure App Insights for mobile apps is great idea – just added them to my Xamarin android app. Since it still in alfa I do not get handled exceptions across to app insights. There’s a great potential here. Also looking in to app memory usage after reading this article. Many thanks.
Hi, Just a quick question regarding memory usage for Xamarin Android – do you consider consuming around 130 – 180 Mb to be normal usage? I have 3 activities with 8 fragments in one of them, some third party controls like charts (all of them being disposed of in OnPause()) and I wander what is considered “acceptable” memory usage. App size is 22 Mb currently have quite a few projects in the solution, using MvvmLight and few components like HockeyApp, AppInsights projects, Geofencing…