In a recent engagement I was tasked to assess the Azure consumption for a customer, they have been exceeding their forecasted budget for last several months. In a short timeframe I had to make sense out of the recon files provided via the Azure Enterprise Portal and present that in a decision-making format that is business understandable and easy to consume. To understand and optimise the cost, it is important to identify and understand where the cost originated, i.e. resources, resource groups and the build spend pattern by analysing the trends.
We all struggle at some point for intelligent visuals to analyse consumption data produced by Azure. Earlier, our options were to play with excel and be a chart artist, rely on Microsoft provided graphs in Azure Portal or ingest into a database and run analysis tools. To make life easier, we ingested the present and historic data into Microsoft Power BI. This Blog discusses the visual capability provided by Microsoft BI that can be used for periodic review of Azure billing data along with Azure provided Advisor tool.
What is Microsoft Power BI?
Power BI is a free application you can either install on your local computer or use the web version, that lets you connect to, transform, and visualize your data. With Power BI Desktop, you can connect to multiple different sources of data, and combine them (often called modelling) into a data model that lets you build visuals, and collections of visuals you can share as reports. One of the data sources is Microsoft Azure Consumption Insight, currently in beta.
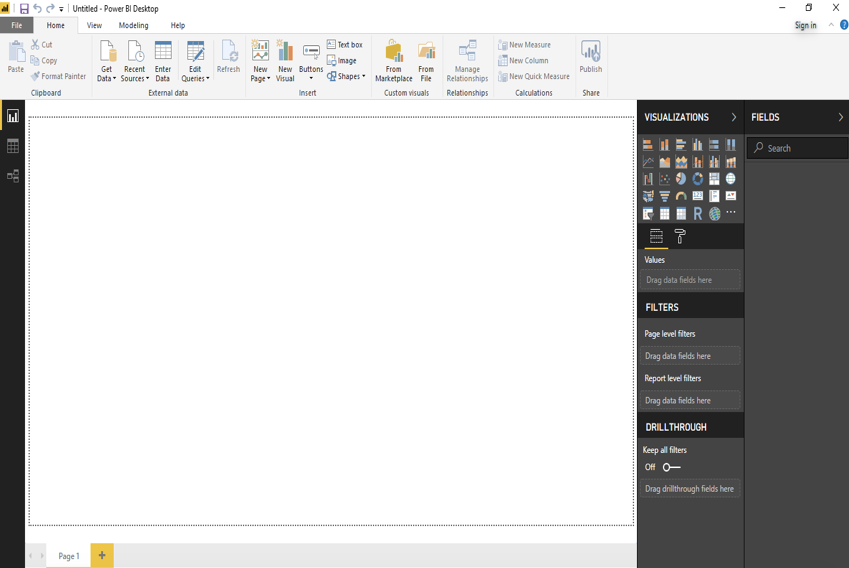
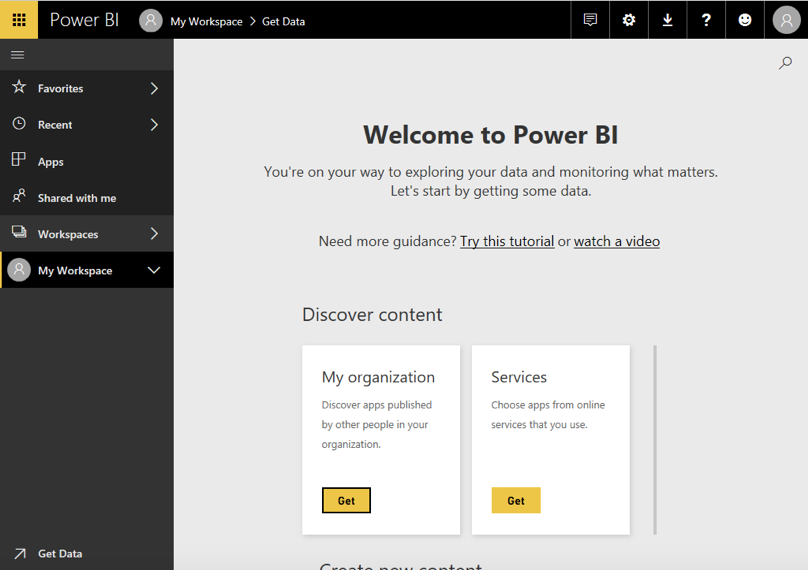
Step 1: Download Microsoft Power BI Desktop (Figure 1) or use web version (Figure 2), in this blog we use web version of Power BI.
Step 2: Ensure that you have a minimum of reader permission on the Azure Enterprise Portal. An existing Enrolment Administrator who has full control can grant you appropriate permissions.
 Step 3: Login to the EA portal and go to the ‘Reporting’ section on the left pane. This will get you to the below screen, go to ‘API Access Key’ and copy the access key, if you do not see an access key speak to the enrolment administrator to generate this. One you have the key make a note of it and keep it in a secured location, you will need this in the following steps.
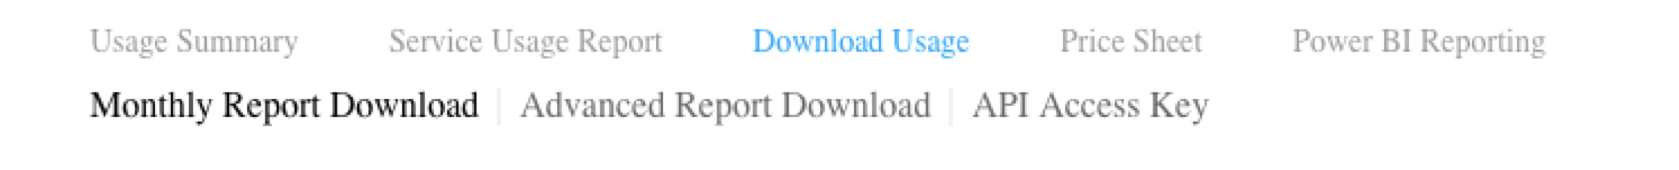
Step 4: While you are logged into the EA portal make a note of the ‘Enrolment Number’ it is available under ‘Manage’ and Enrolment Details. You will need this in the following steps.
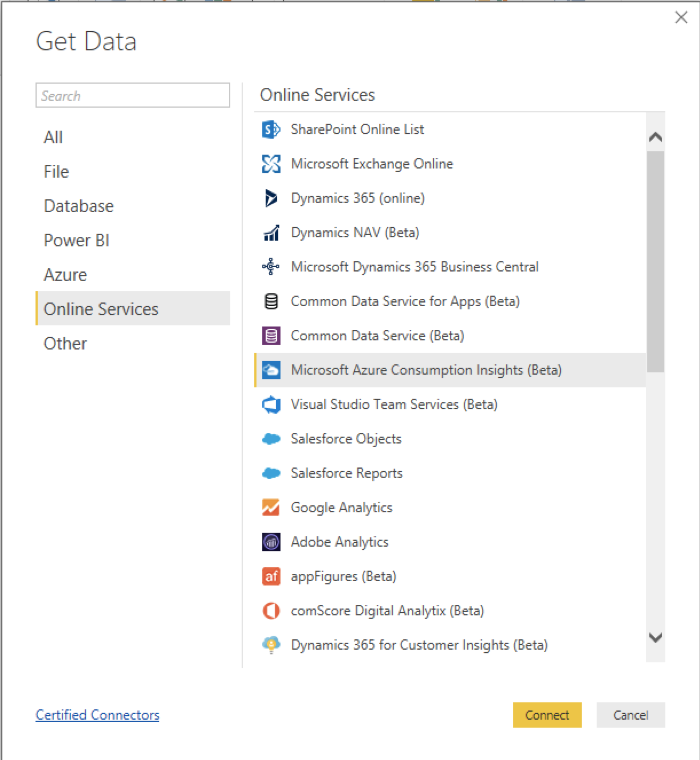
Step 5: Launch the Power BI Desktop app you downloaded or open https://app.powerbi.com/groups/me/getdata/welcome. Click on ‘Get Data’ to connect to the EA portal APIs, in the desktop app it is located in the ‘Home’ menu ribbon and in the web version it is located at the bottom left pane. One you have launched get data, you will see the below window. Go to ‘Online Services’ in the left list and select ‘Microsoft Azure Consumption Insights (Beta)’ on the right list and hit ‘Connect’.
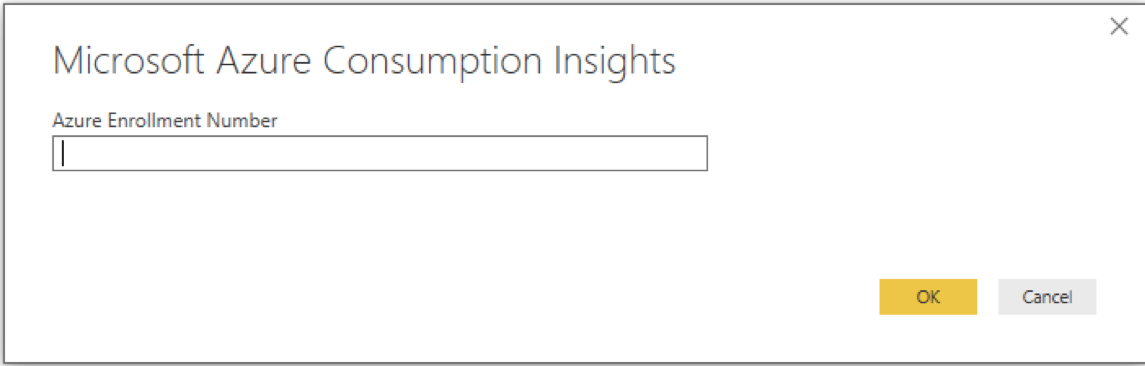
Step 6: One you connect the new window will ask you to provide the ‘Enrolment Number’ you captured in Step 4. Input that number and hit ‘OK’
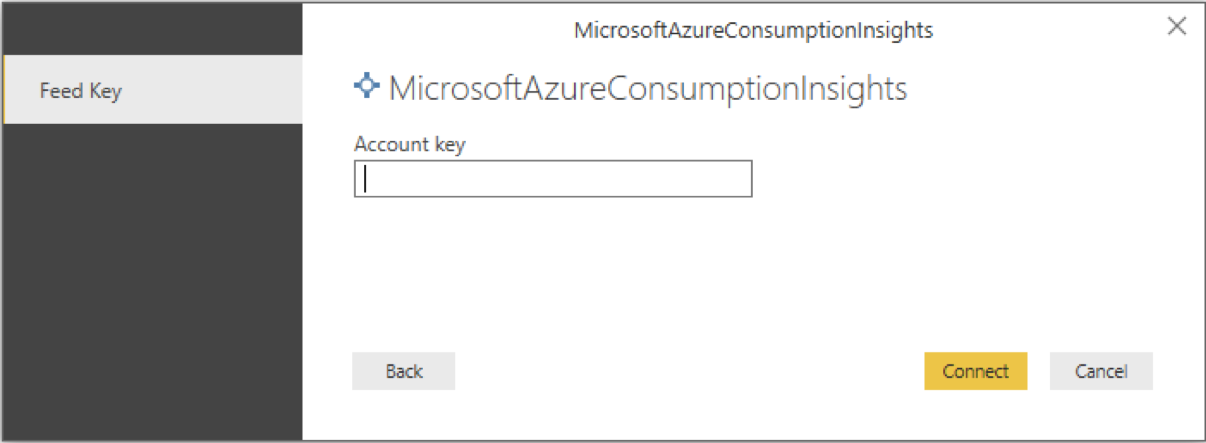
Step 7: Now input the Account Key you captured in Step 3 and hit ‘Connect’. In the next screen you’ll be presented with multiple options to select from, choose ‘Usage’. One you have made your choice, this could take few to several minutes to ingest data from the portal.
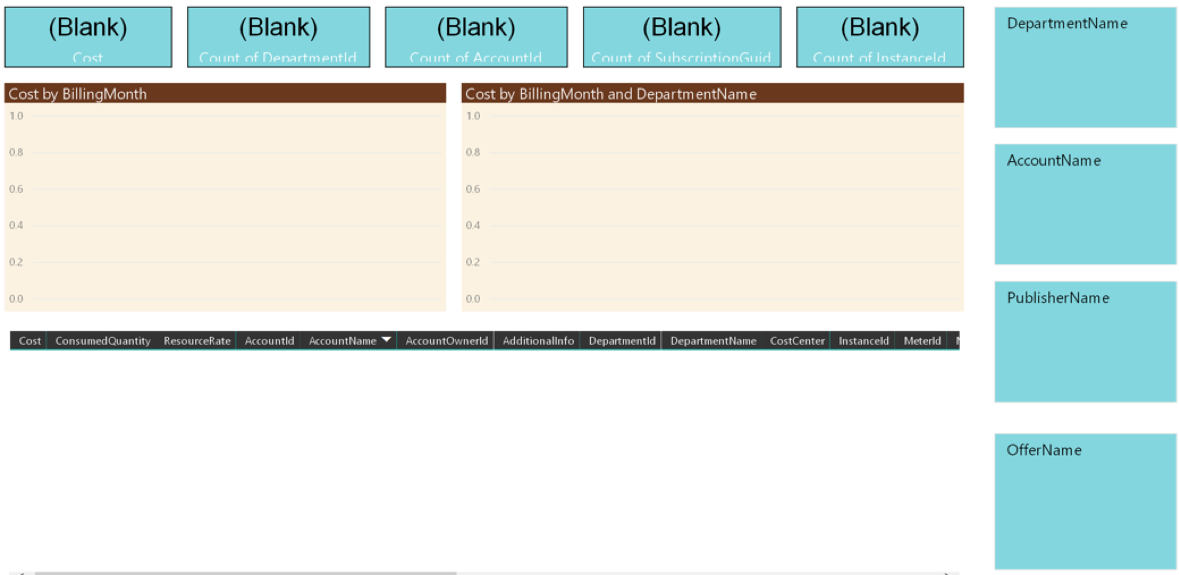
Step 8: When the data source is connected you will see consumption data with dashboard for your enterprise. Default data is provided in following tabs:
- Usage Trend by Account and Subscriptions graph provide a summary view of enterprise consumption by subscription and various accounts in EA portal
- Usage Trend by Services
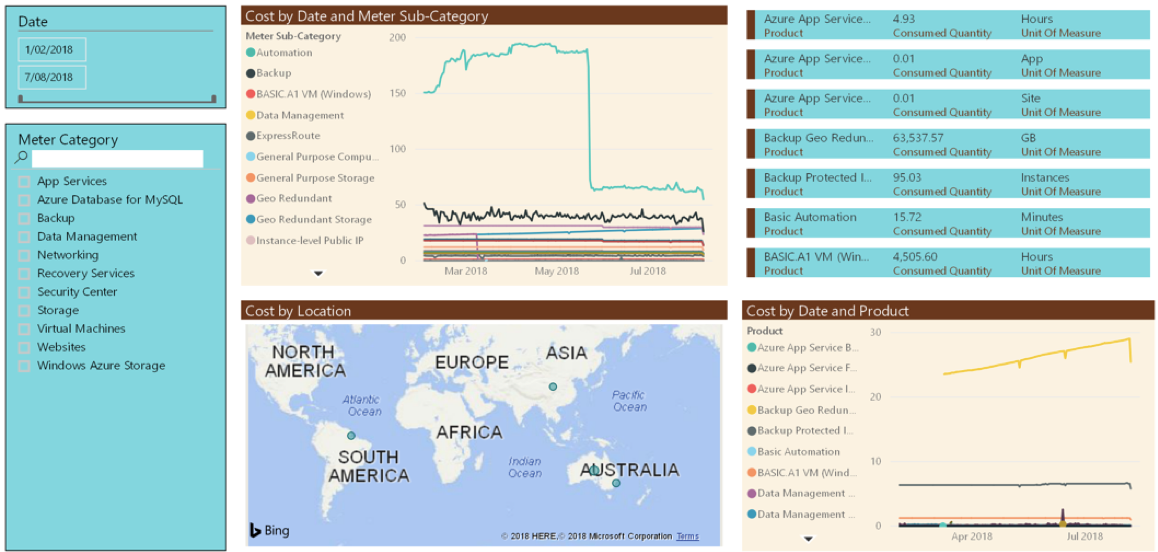
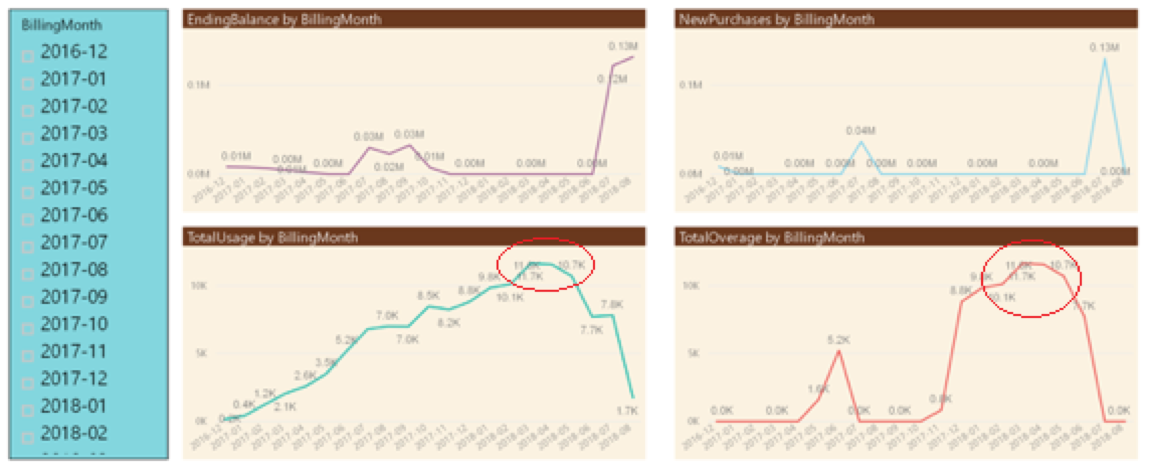
- Top 5 Usage Drivers graph provide a visual for each of the resources by ‘Meter Name’. Meter Name is the identifier used by Microsoft Azure to monitor consumption by resource type for billing purposes. Highlighted period indicated unusual consumption.
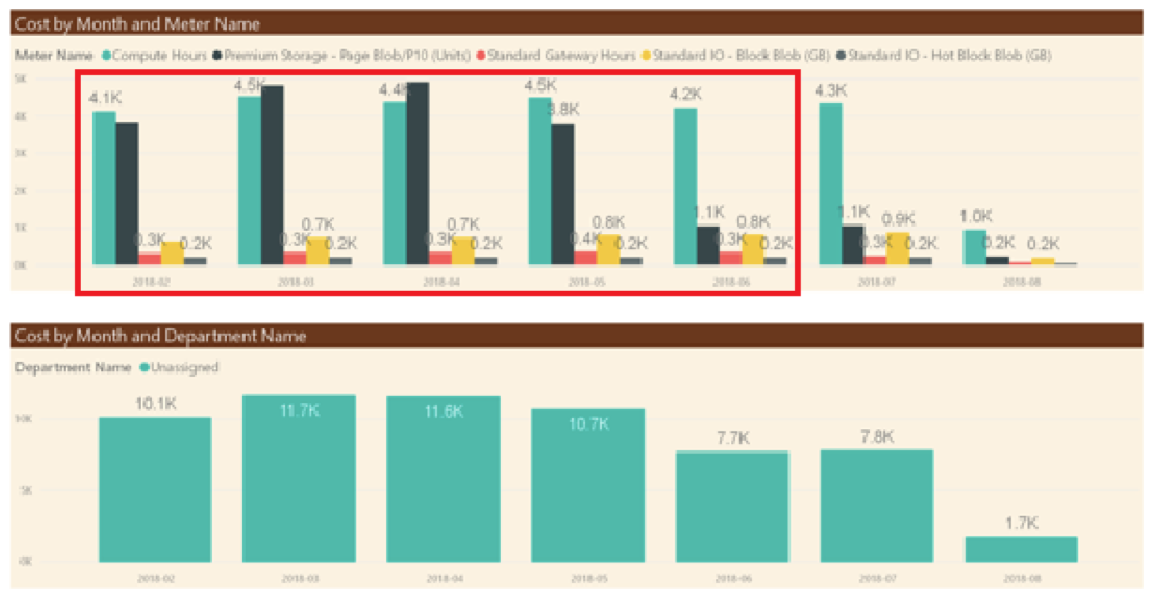
- Usage Summary. When compared with the previous graph (Top 5 Usage Drivers) and the period highlighted in the below graph, analysis confirmed an unusual consumption. We drilled into the usage detailed for further analysis for this period which revealed high usage of premium managed disks and discussed with the customer about the change during this period.
- Market Place Charges provides you any purchases from Azure Marketplace. In this case, customer did not have any third-party usage.
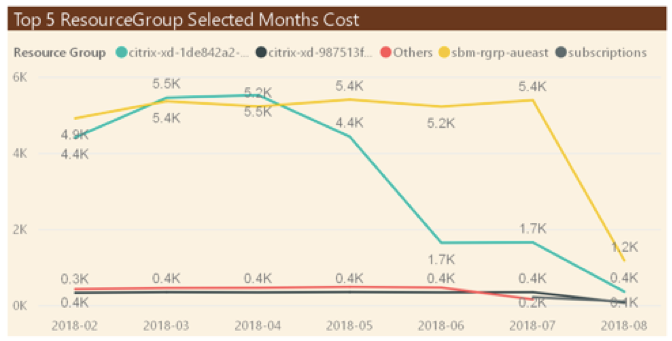
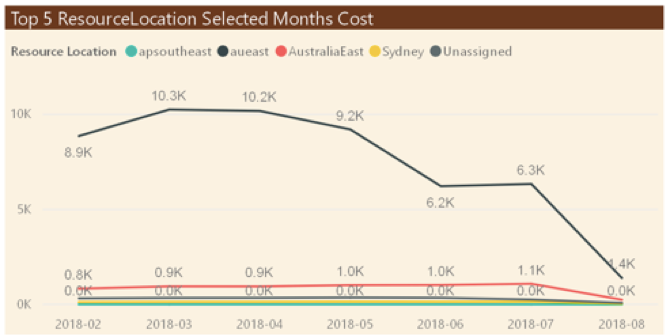
- Usage dashboards based on Tags, Resource Groups, Location continued to point to unusual consumption of premium disks. Usage by tags data is only available if you have tagged your resources in Azure.
Conclusion
After careful observation and detailed analysis of the data ingested from the EA portal, it was concluded that the premium disk usage (as discussed earlier in this blog) for the period of several months (highlighted in earlier figures) had done the major damage to their financials, which was due to the application design that consumed the premium storage. Fixing the application configuration optimised the disk usage and dropped the cost significantly in the following months, i.e. 2018-06 to 2018-08.
Power BI provides you the capability to download the analysis in a PowerPoint format that help present and use the visuals in your report, similar to the graphs discussed in this blog.
Cloud Services have revolutionised the way Information Technology (IT) departments support their organisation to be more productive without investing huge capital upfront on building servers, procuring software’s etc. The key to effective use of Cloud Service is planning, and one of the key areas to effectively forecast is consumption to prevent unexpected charges. This section highlights some of the best practices to be more predictable:- To get a better idea of your spend, Azure pricing calculator can provide an estimate of costs before you provision an Azure resource.
- Account Admin for an Azure subscription can use the Azure Billing Alert Service to create customized billing alerts that help you monitor and manage billing activity for your Azure accounts.
- Apply tags to your Azure resources to logically organize them by categories. Each tag consists of a name and a value. After you apply tags, you can retrieve all the resources in your subscription with that tag name and value.
- Regularly checks for cost breakdown and burn rate allows you to see the current spend and burn rate in Azure portal.
- Consider enabling cost-cutting features like auto-shutdown for VMs where possible. This can be enabled either in the virtual machine configuration or via runbook(s) through the automation account
- Periodic review of Azure Advisor recommendation helps you reduce costs by identifying resources with low usage and possible cost optimisation
- Pre-paying for one-year or three-years of virtual machine or SQL Database compute capacity via Azure reservations for virtual machines or SQL databases that run for long periods of time. Pre-paying allows you to get a discount on the resources you use. Azure reservations can significantly reduce your virtual machine or SQL database compute costs—up to 72 percent.