Because of the nature of Azure Functions – Serverless Architecture, it’s a bit tricky to run it on my local machine for debugging purpose.
There is an approach related to the issue in this post, Testing Azure Functions in Emulated Environment with ScriptCs. According to the article, we can use ScriptCs for local unit testing. However, the question on debugging still remains because testing and debugging is a different story. Fortunately, Microsoft has recently released Visual Studio Tools for Azure Functions. It’s still a preview stage, but worth having a look. In this post, I’m going to walk-through how to debug Azure Functions within Visual Studio.
Azure Functions Project & Templates
After we install the toolings, we can create an Azure Functions project.
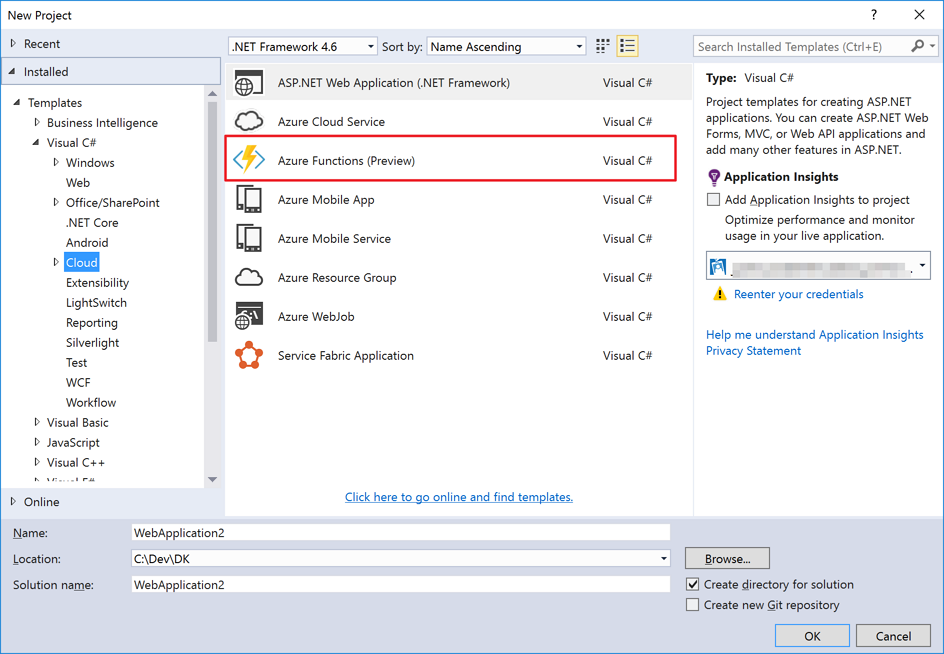
That gives us the same development experiences. Pretty straight forward. Once we create the new project, we can find nothing but only a couple of .json files appsettings.json and host.json. The appsettings.json is only used for our local development, not for the production, to hook up the actual Azure Functions in the cloud. We are going to touch this later in this post.
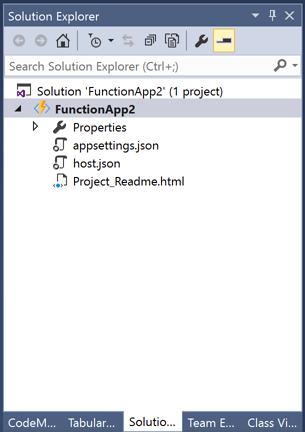
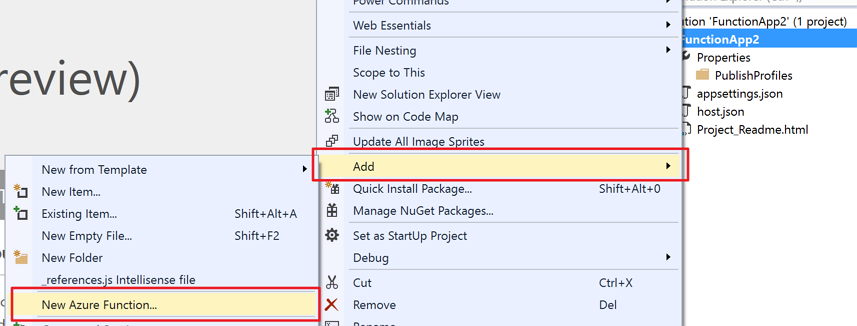
Now let’s create a function in C# codes. Right mouse click on the project and add a new function.
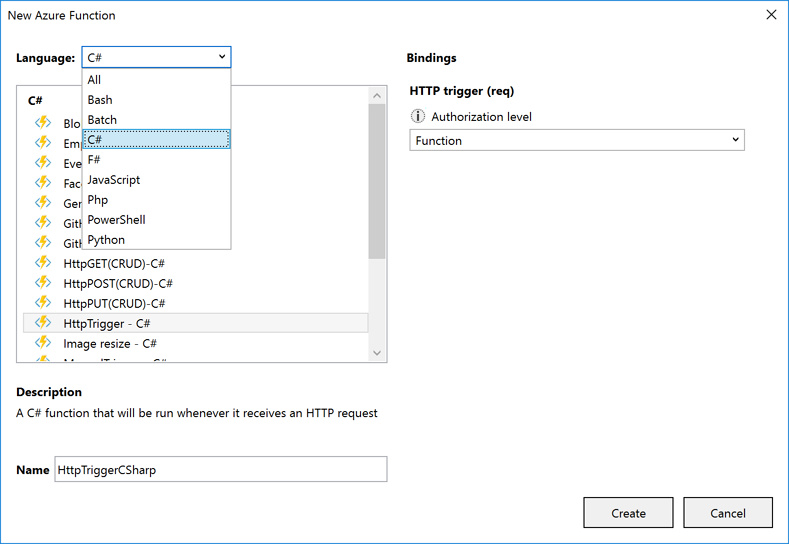
Then we can see a list of templates to start with. We just select from HttpTrigger function in C#.
Now we have a fresh new function.
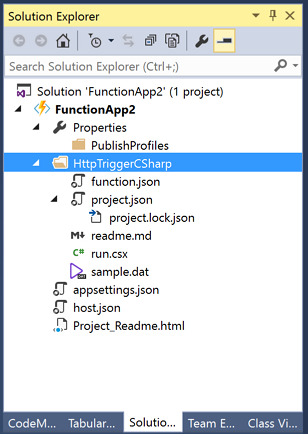
As we can see, we have a couple of another .json files for settings. function.json defines input and output, and project.json defines list of NuGet packages to import, same as what .NET Core projects do.
We’ve all got now. How to debug the function then? Let’s move on.
Debugging Functions – HTTP Trigger
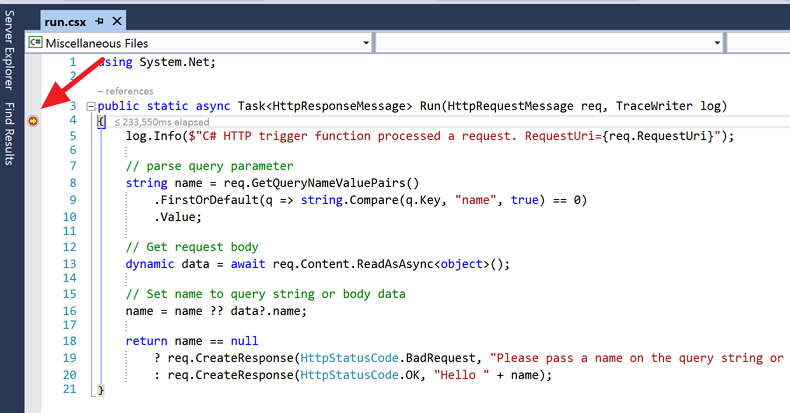
Open the run.csx file. Set a break point wherever we want.
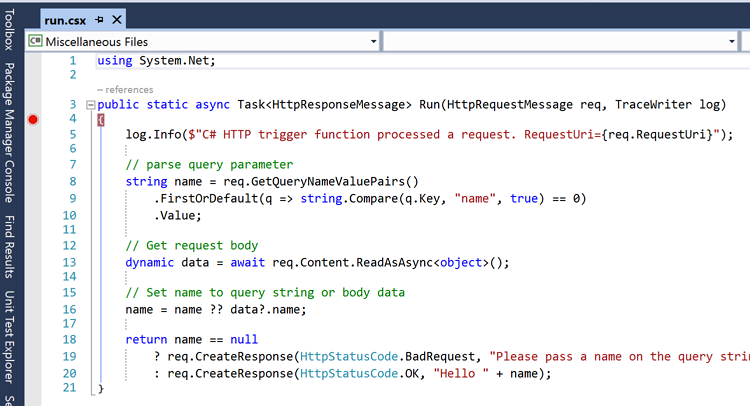
Now, it’s time for debugging! Just punch F5 key. If we haven’t installed Azure Functions CLI, we will be asked to install it.
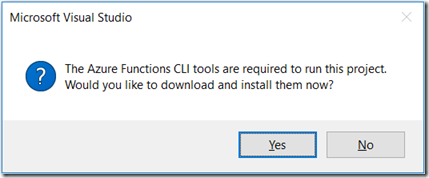
We can manually install CLI through npm by typing:
Once the CLI is installed, a command prompt console is open. In the console, it shows a few various useful information.
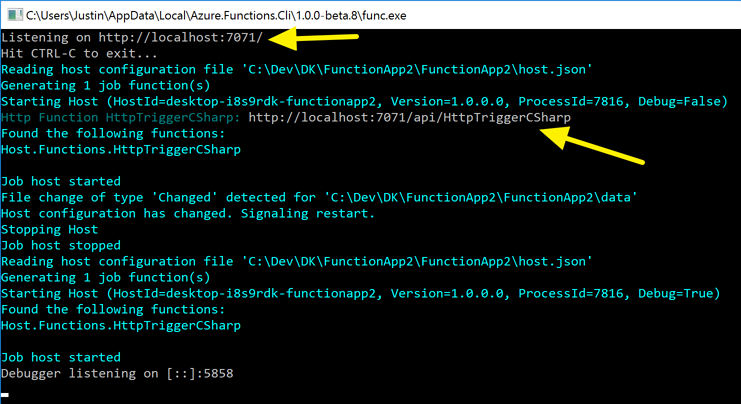
- Functions in the debugging mode only takes the
7071port. If any of application running in our local has already taken the port, it would be in trouble. - The endpoint of the Function is always
http://localhost:7071/api/Function_Name, which is the same format as the actual Azure Functions in the cloud. We can’t change it.
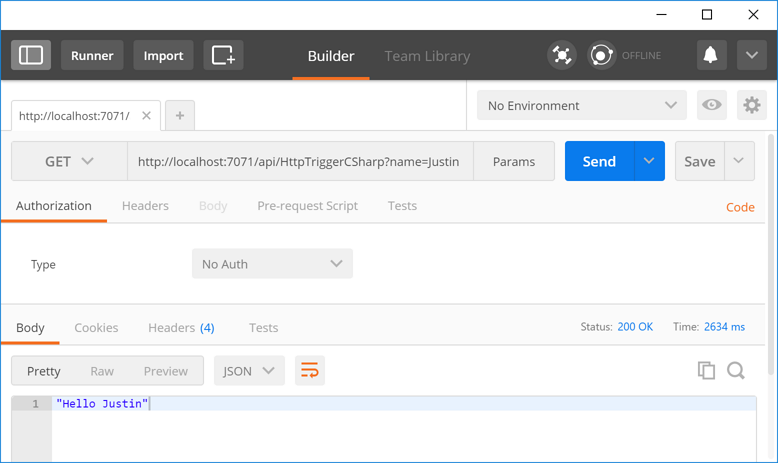
Now it’s waiting for the request coming in. It’s basically an HTTP request, we can send the request through our web browser, Postman or even curl.


Any of request above is executed, it will hit the break point within Visual Studio.
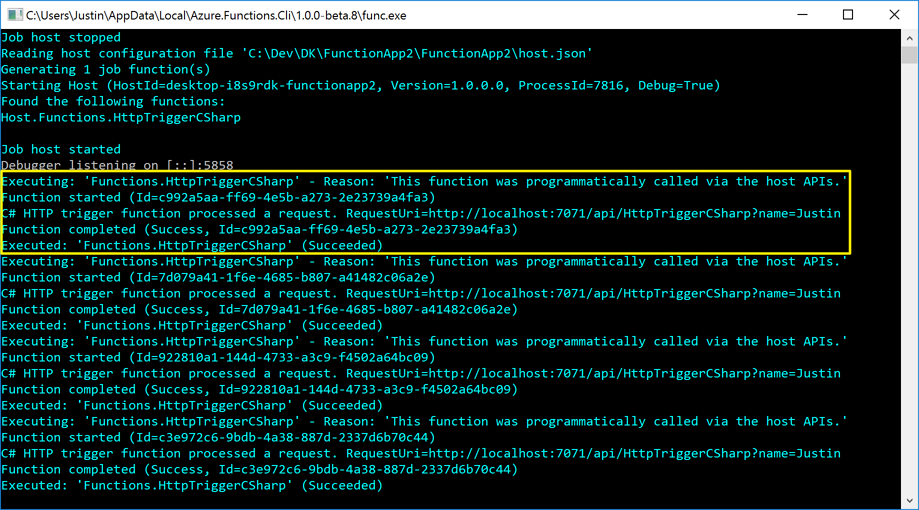
And the CLI console prints out the log like:
Super cool! Isn’t it? Now, let’s do queue trigger function.
Debugging Functions – Queue Trigger
Let’s create another function called QueueTriggerCSharp. Unlike HTTP triggered functions, this doesn’t have endpoint URL (at least not publicly exposed) as it relies on Azure Storage Queue (or Azure Service Bus Queue). We have Azure Storage Emulator that runs on our dev machine. With this emulator, we can debug our queue-triggered functions.
In order to run this function, we need to setup both appsettings.json and function.json
Here’s the appsettings.json file. We simply assign UseDevelopmentStorage=true value to AzureWebJobsStorage for now. Then, open function.json and assign AzureWebJobsStorage to the connection key.
We’re all set. Hit F5 key see how it’s going.
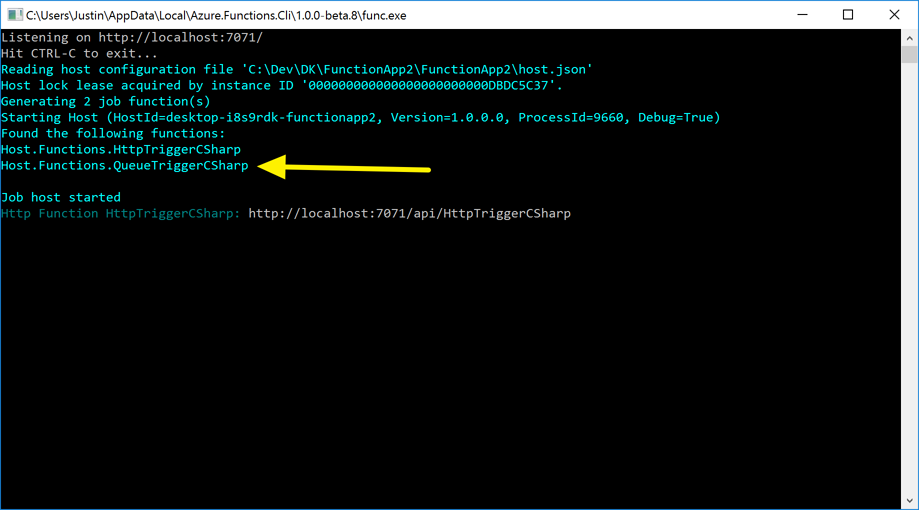
Seems nothing has happened. But when we see the console, certainly the queue-triggered function is up and running. How can we pass the queue value then? We have to use the CLI command here. If environment variable doesn’t recognise func.exe, we have to use the full path to run it.
Now we can see the break point at Visual Studio.

So far, we’ve briefly walked through how to debug Azure Functions in Visual Studio. There are, however, some known issues. One of those issues is, due to the nature of .csx format, IntelliSense doesn’t work as expected. Other than that, it works great! So, if your organisation was hesitating at using Azure Functions due to the lack of debugging feature, now it’s the time to play around it!
