There are some new and powerful Business Intelligence options available to all of us, from scalable cloud platforms to the Excel on the desktop. So its a good time to demonstrate some of them and show where BI and Application Development meet.
Power Query and the language M have been quietly making their way into the Microsoft Business Intelligence stack and in particular Excel for some time. The set of “Power” components (Power Query, Power Pivot and Power BI) all sound a bit like the marketing guys won the naming battle again and don’t really help explain the technology nor where they fit so I avoided it for a long time. That is until this latest version of Office where you can’t really avoid it. So it came time to take Power Query and M by the scruff and learn it.
First let’s put these new “Power” technologies in their relative places:
- M is a new language that takes on the ET from ETL (Extract Transform and Load). It is a scripting language which looks like an odd mix of VBScript and PowerShell and “R”. It has constructs for importing and manipulating Tables, Lists and Records including the ability to do joining and grouping
- Power Query is a scripting environment which is an add-on to Excel adding GUI support for creating and editing M scripts. It hides away the M language from the punter but you’ll quickly find the need to drop into the M script editor for all but the basic scripting chores.
- Power Pivot is a multidimensional analysis engine without the need to use the full MSSQL OLAP Analysis Services. PowerPivot is available as a plug in for Excel but executes over what is called the Data Model an in memory database capable of much larger datasets than Excel.
- Power BI Designer is a standalone BI development environment which includes Power Query and PowerPivot. It’s for the power business user to develop reports from data without the need to drop into or distribute Excel.
So I set myself a goal to create a spreadsheet that auto updates with stock prices.
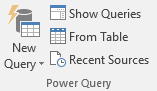
First get a version of Excel (2010 or above) which supports Power Query and download the Power Query installer this is already embedded in the later versions of Excel but may need an update. After installing you should get a set of new buttons like this. The New Query button replaces the previous Get External Data features of Excel and is the entry point to load data into the Power Query environment.
Yahoo Finance
Yahoo Finance have kindly exposed a number of APIs for requesting stock price information (if used for non-commercial purposes), current and historical for just about every instrument you can think of. These APIs are simple web queries but predate the REST API conventions so don’t follow nice RESTful best practice. The two services we’ll use are:
Historical: http://ichart.finance.yahoo.com/table.csv?s=CPU.AX&a=00&b=4&c=2014&d=07&e=01&f=2015&g=d&ignore=.csv
This will return historical prices between two dates.
Quote: http://download.finance.yahoo.com/d/quotes.csv?s=CPU.AX&f=nsl1op.
This will return the latest quote for the stock CPU.AX with a number of fields identified by the f parameter.
Both APIs are very well documented (counter intuitively) at Google Code
Pulling this data into Power Pivot is really easy from which it’s even easier to post process and report.
Historical Query
So let’s import one of these services. The New Query button has a huge number of different data sources. For this purpose, we’ll use simply “Web” and import the historical data service by pasting in the above URL. This will query the service, display the data and launch the Power Query editor.
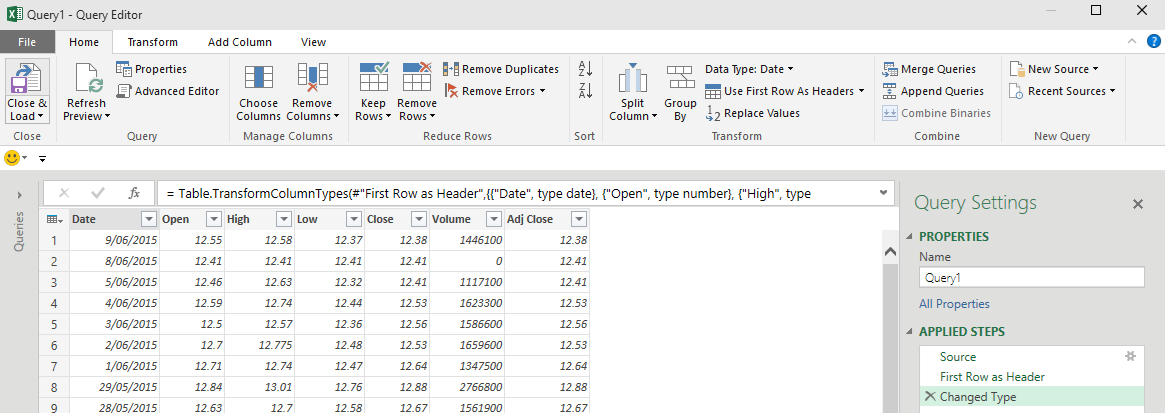
Here’s our first glimpse of the new data staging area. There’s a whole lot of buttons here for transforming and massaging the returned data and everything that is done with the buttons in the GUI become M statements in an M query which can be a great way to learn the language. And there is a data grid (not Excel this one is part of Power Query) to show the query results.
Try hitting the button “Advanced Editor”.
let
    Source = Csv.Document(Web.Contents("http://ichart.finance.yahoo.com/table.csv?s=CPU.AX&a=00&b=4&c=2014&d=07&e=01&f=2015&g=d&ignore=.csv"),[Delimiter=",",Encoding=1252]),
    #"First Row as Header" = Table.PromoteHeaders(Source),
    #"Changed Type" = Table.TransformColumnTypes(#"First Row as Header",{{"Date", type date}, {"Open", type number}, {"High", type number}, {"Low", type number}, {"Close", type number}, {"Volume", Int64.Type}, {"Adj Close", type number}})
in
    #"Changed Type"
Ah, now we get our first glimpse of M. The Web import wizard created a set of M code that queried the URL, determined the type of data returned (csv), determined the first row is headers and had a guess at the column types of the data and returned that data as a Table.
Breaking down the code:
- A Query starts with (a very BASIC looking) “let”
- A set of case sensitive statements (or Steps) that are separated by commas
- Variables look like #”variablename” are created by assignment and adopt the returned type (much like Powershell a var in C#)
- M is optimised for speed and therefore uses short circuit evaluation; that is a statement line wont execute if it isn’t required for the end value.
- A Query end in an “in” statement to represent the data returned from the query.
Load
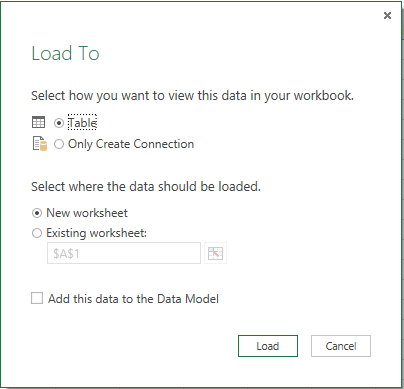
Now choose Close and Load To…. This is the point where Power Query tips into Excel or other tool you may be using to display data. The choice here is either to load the query into an Excel Table the PowerPivot Data Model or simply save the code into a stored query “Connection” for later use.
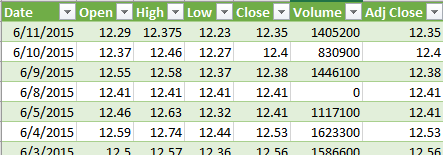
Choose Table and you should end up with something like this
Function
Now wouldn’t it be good if we could parameterise that query so it could be used for other stocks and dates. We can upgrade that original query to be a function. Open the Advanced Editor again on the query and overwrite with this.
let
     historical= (symbol as text, days as number) =>
let
    #"toDate" = DateTime.LocalNow(),
    #"fromDate" = Date.AddDays(#"toDate", 0-days),
    #"fromDateString" = "&a=" & Text.From(Date.Month(fromDate)-1) & "&b=" & Text.From(Date.Day(fromDate)) & "&c=" & Text.From(Date.Year(fromDate)),
    #"toDateString" = "&d=" & Text.From(Date.Month(toDate)-1) & "&e=" & Text.From(Date.Day(toDate)) & "&f=" & Text.From(Date.Year(toDate)),
    Source = Csv.Document(Web.Contents("http://ichart.finance.yahoo.com/table.csv?s=" & symbol & #"fromDateString" & #"toDateString" & "&ignore=.csv"),[Delimiter=",",Encoding=1252]),
    #"SourceHeaders" = Table.PromoteHeaders(Source),
    #"Typed" = Table.TransformColumnTypes(#"SourceHeaders",{{"Date", type date}, {"Open", type number}, {"High", type number}, {"Low", type number}, {"Close", type number}, {"Volume", Int64.Type}, {"Adj Close", type number}})
in
    #"Typed"
in
    historical
First thing to note is the code structure now has a query in a query. The outer query defines a function which injects some variables into the inner query. We’ve parameterised the stock symbol, and the number of days of history. We also get to use some of the useful M library functions as defined in here Power Query Formula Library Specification to manipulate the dates.
Now rename the new “function” as fHistorical and choose Home=>Close and Load.

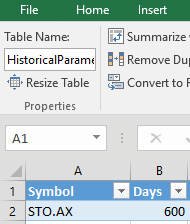
At this point it’s easy to test the function using the Invoke command which will prompt for the parameters. To execute it from Excel we’ll provide the data from Excel cells. In Excel use Insert=>Table to insert a table with two columns named Symbol and Days and name the table “HistoricalParameters”. Note we have just created an Excel Table which is different to a Power Query Table, although you can use a Power Query Table to load data into and read data from an Excel Table (confused yet?).
Now it’s time for some more M. Move the Excel cursor down a few Cells to a clear area on the Worksheet. Then New Query=>Other Sources=>Blank Query and paste in this code.
let
    Source = Excel.CurrentWorkbook(){[Name="HistoricalParameters"]}[Content],
    #"Symbol"=Source{0}[Symbol],
    #"Days"=Source{0}[Days],
    #"Historical" = fHistorical(#"Symbol",#"Days")
in
    #"Historical"
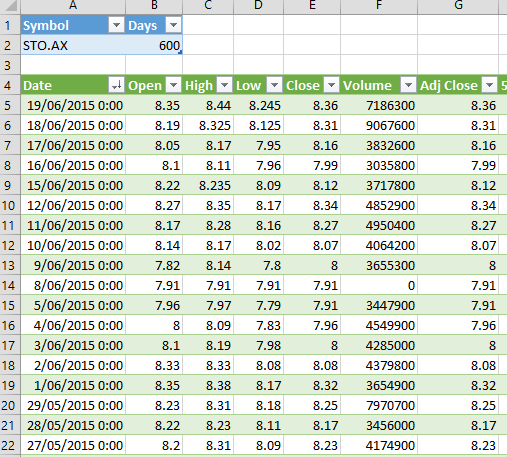
This will take the HistoricalParameters table we created in Excel, pull out the data from the Symbol and Days columns. And use that to call our fHistorical function. Close and Load that query into an Excel table called Historical. I put both the Historical and the HistoricalParameters tables on the same Worksheet so you can update the Symbol and the Days and see the result. It looks like this. To get the query to run with new data either hit the Data Refresh button in Excel or Right Click and Refresh on the Historical table.
Note once you have data in an Excel Table like this, it’s easy to add additional calculated columns into the table auto update when the query does.
Formula Firewall
One of the areas that can be confusing is the concept of Privacy Levels. Power Query is built with sharing of queries in mind. Users can share queries with others but a Data Source must be declared with its privacy level to ensure that data from secure sources aren’t combined with insecure sources. This is done via the very fancy sounding Formula Firewall.
You can control the privacy level of every data source or but when developing a query the restriction imposed by the firewall can be confusing and can lead to the dreaded error message.
"Formula.Firewall: Query 'QueryName' (step 'StepName') references other queries or steps and so may not directly access a data source. Please rebuild this data combination."
So for now I’m going to turn off the Formula Firewall.
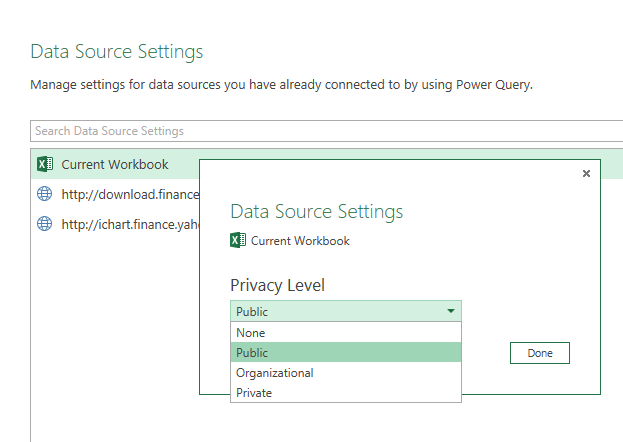
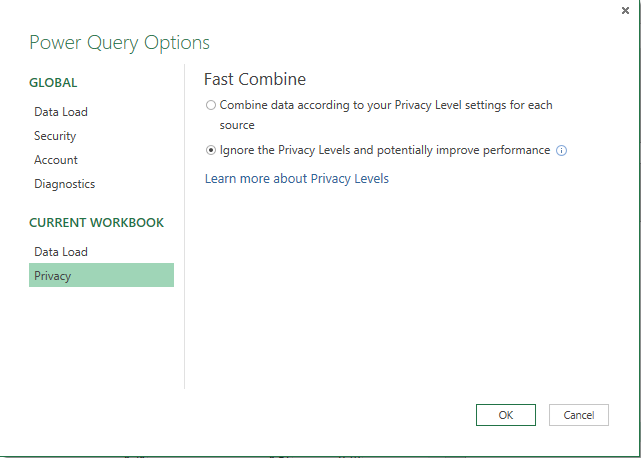
Use the Excel Query top level menu and click the Edit button. This will open the Power Query Editor window. Now go to File=>Options and Settings=>Query Options and click on Privacy. Set the Ignore Privacy Levels option.
Portfolio Query
OK now onto something more complex, a portfolio. The Quote Yahoo URL takes two parameters, s and f. “s” is a comma delimited list of stock symbols and f is a list of fields to return. There are actually 90 fields which can be returned for a stock by concatenating the list of alphanumeric codes for the fields. What would be good is to create a query that can request a number of stocks for a user defined set of columns. The set of codes is well described in this page so let’s take that data and add it into an Excel worksheet and make it into an Excel Table by highlighting the cells and select Insert=>Table which will convert it to an Excel Table and rename it “FieldLookup”. Now rename columns and add a “Type” and “Display” column. So you end up with something like this.
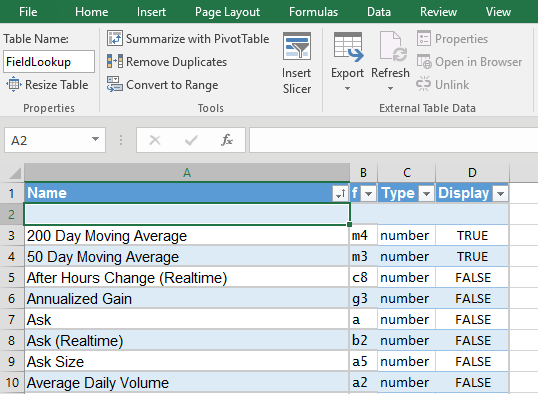
The “Display” column is used to determine which fields are to be queried and displayed. The “Type” column is used to encourage Excel to use the right column type when displaying (everything will still work using the default Excel column type, but Numeric and Date columns wont sort nor filter properly).
Now in a new Excel sheet and add table called Portfolio with a single column Symbol and add some stock code symbols. It is this table which will be used to fill with data for the required stocks and using all of the required display fields.
Now to create a new Query
let
    PortfolioSource = Excel.CurrentWorkbook(){[Name="Portfolio"]}[Content],
    #"sParam" = Text.Combine(Table.ToList(Table.SelectColumns(PortfolioSource, "Symbol")),","),

    #"Fields" = Excel.CurrentWorkbook(){[Name="FieldLookup"]}[Content],
    #"DisplayFields" = Table.SelectRows(#"Fields",each [Display]=true),
    #"fParam" = Text.Combine(Table.ToList(Table.SelectColumns(#"DisplayFields", "f")),""),

    #"DisplayColumns" = Table.ToList(Table.SelectColumns(#"DisplayFields", "Name")),
    #"TypeNames" = Table.SelectRows(Table.SelectColumns(#"DisplayFields", {"Name","Type"}), each [Type]="number"),
    #"ColumnTypes" = Table.AddColumn( #"TypeNames", "AsType", each type number),
    #"ColumnTypesList" = Table.ToRows( Table.SelectColumns(#"ColumnTypes",{"Name","AsType"})),

    #"YahooSource"= Csv.Document(Web.Contents("http://download.finance.yahoo.com/d/quotes.csv?s=" & #"sParam" & "&f=" & #"fParam"), #"DisplayColumns"),
    #"TypedYahooSource" = Table.TransformColumnTypes(#"YahooSource",  #"ColumnTypesList")
in
   #"TypedYahooSource"
Here’s what is happening
- PortfolioSource: Get the Portfolio table and take just the Symbol column to create a single column Table
- #”sParam”: Now combine all the rows of that table with commas separating. This will be the “s” parameter of the yahoo Quotes request
- #”Fields”: Now get the table content from the FieldLookup table
- #”DisplayFields”: Select just the rows that have a Display column value of true. Here’s we see the first use an inline function executed for every row using the “each” keyword (a bit like a C# Linq query).
- #”fParam”: Combine all the rows of #”DisplayFields” with no separator to create the “f” parameter.
- #”DisplayColumns”: Choose the Name column from the table to be used later
- #”TypeNames”: Choose the Name and Type column where the type is a number
- #”ColumnTypes”: Add a new column of type number. This is the first time we see the type system of M there are all the simple types and some additional ones for Record, List and Table etc.
- #”ColumnTypesList”: Create a list of lists where each list item is a column name and the number type
- #”YahooSource”: Now make the query to yahoo finance with our preprepared “s” and “f” parameters
- #”TypedYahooSource”: Run through the returned table and change the column types to number for all required number columns
Now Close and Load the Query. This will generate a query like this.
http://download.finance.yahoo.com/d/quotes.csv?s=BKN.AX,MRM.AX,CAB.AX,ARI.AX,SEK.AX,NEC.AX&f=m4m3c1m5m7p2er1j4e7ql1nt8r5rr2p6r6r7p1p5s6s7st7yvkj
And a Portfolio table like this
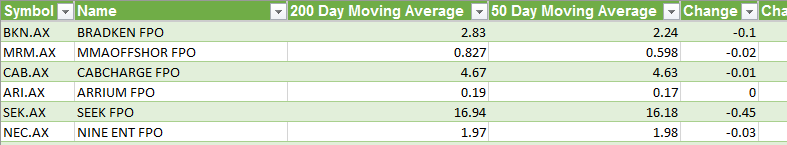
Every column that has a “true” in the Display column of FieldLookup table will get a column returned with data. To add and remove stocks from the portfolio, just add, remove or edit them right there in the Symbol column of the Portfolio table. Hit Refresh and the data is updated!
Heres the final spreadsheet YahooFinanceStocks
As I was feeling around PowerQuery and M I’m left with a nagging feeling. Do we need another language? And another development environment, without debugging, intellisense, or syntax highlighting? Definitely not!
M is reasonably powerful but seems to have snuck into the Microsoft stack before what I call the “open era”. That is Microsoft’s new model of embracing open source rather than competing against it. Which brings me to R. R can do all of that and more and there is much more community backing. R is now a language appearing across interesting new Microsoft products like Azure Machine Learning and even inside SQL Server.
So I’ll crack that nut next time.
There is a subtle detail missing in the Historical section. I built the table for the parameters and was having trouble understanding were to put the query that links the parameters to the data query. If you have the time read through your explanaition and see if there is a little detail that was left out. Thank you.
There is only one query for the Historical, it will use both the Portfolio table
PortfolioSource = Excel.CurrentWorkbook(){[Name=”Portfolio”]}[Content],
and the Fields table
#”Fields” = Excel.CurrentWorkbook(){[Name=”FieldLookup”]}[Content],
The yahoo finance query is constructed from data from both the tables.
Check out the attached Excel spreadsheet
@Peter – Is there a way to make Power Query remember “Ignore Privacy” – It appears that if you send this file to some one else – the person has to again go and first say Ignore privacy
What you can do is set the Query Options to “Combine data according to your Privacy Level settings for each source”. Then each query will get a “Formula.Firewall” warning. Open each query in the Query Editor and click on the “Information is required about data privacy” and set to “Public”. The point of all this formula firewall stuff is to ensure that you don’t leak information unintentionally when aggregating multiple sources. By selecting Public on these queries you are declaring that you are happy to send your stock portfolio to Yahoo.
This worked great for me. It really helps me.
http://marketxls.com/portfolio-manager/
Power Query works fine until I enter the ticker symbol and #days at which time instead of receiving the expected data the command returns a string of code.
I can get the data if I were to manually use the “Invoke” command.
I’m making a wild guess as I only have a high level understanding of the code, but I think my problem might be in the following script:
let
Source = Excel.CurrentWorkbook(){[Name=”HistoricalParameters”]}[Content],
#”Symbol”=Source{0}[Symbol],
#”Days”=Source{0}[Days],
#”Historical” = fHistorical(#”Symbol”,#”Days”)
in
#”Historical”
My question:
Should I have created a file named “fHistorical?”
Richard.
fHistorical is a PowerQuery function. You can Invoke it manually and provide a symbol (e.g. “CPU.AX”) and a number of days (e.g. 200) and it will return the history for that stock.
There is PowerQuery query called Historical which will look for a table in the current Excel workbook called “HistoricalParameters” and do the Invoke for you with the Symbol and Days values from that table and fill an Excel table with the results.
The “Historical” sheet in the Excel workbook uses this query to populate the results any time there is a Data Refresh
I’m having a similar issue with fHistorical. Where is it defined/implemented?
Oh yeah! The function should have been called fHistorical, not Historical. image and text updated to fHistorical
Peter, can you look at my problem? I used New Query=>Other Sources=>Blank Query to enter the Code ending with #”Historical”. I created the two tables “Historical Parameters” and “Historical” but cannot get “Historical” populated with the results of the sticker query. The error I got read “Invalid Table Range. The selected range is invalid. A table cannot overlap a range that contains a Pivot Table report, query results, protected cells or another table.” I tried directing the output to a new worksheet but the output is the text of the above-mentioned code. How should I create the “Historical” Table to accept the report? Rick.
OK yes I see it, thanks.
You just need to move the cursor down a few cells before creating the second table on that Worksheet. Ive updated the blog entry text.
very impressive! Very much appreciated the great write up, comments about M, DAX, R, open software support, etc. M is challenging to understand (M$FT, what were you thinking?), at least at first (…WOW MAN is THIS different or WHAT???) Integration with Excel, VBA, DAX, VBA-IDE is nascent at best or simply intentionally ignored. Your example is really nice to show how to get behind the GUI (not exactly Excel consistent/friendly) and somehow get a modest idea of how M might actually be used FROM Excel. Of course a quick query to Yahoo based on a list of tickers in a spreadsheet column should be so simple a grandmother could do it. (“Advanced editor” is an oxymoron; just love that snappy on-line / chm documenation.) And not being able to connect to a dbf file (when most of the GIS world uses them daily) is pretty arrogant, especially given that M$FT purchased FoxPro. The jurry is still out on M, especially via Excel, especially since there are other, much more open Extract/Transform/Load options availalbe for various and sundry data types when you toss Excell out the window to begin with. MSFT query was “Poor”,”Power Querry” seems “Better”, (DAX and compressed data are indeed impressive features), but where is “Best”? M seems “far from ringing the bell at the fair” just yet. One can only hope the implementation will not be entirely “reactive” … an “agile response” to what the largest customers are screaming for at the moment. I think they sort of forgot that spreadsheets were an implementation of VISUAL computing? Thanks again for posting this!!! Rick
Ha! Glad you enjoyed it.
FYI – Moving averages (MA 50, MA 200) are not calculated correctly by m3 & m4 tags. These take all days (not trading days in calculation).
Yes I think Yahoo Finance is wrong there. A 50 day moving average should be the sum of the last 50 data points divided by 50. Non trading days should not be considered as data points. I create my own MAV using a calculation in the table.
First of all amazing. Second, what is the easiest way to ignore the errors? I keep getting an error on P/E saying that it can’t convert to a number?
Also, I am assuming Yahoo does not have a data point for a 1 year return?
Thanks
Brendan
Glad you like it
Some fields from Yahoo look like they are numbers but the data is not always a number. You can just change the Type in the FieldLookup table to text which will stop the error but you wont be able to sort the field numerically.
Yahoo Finance has an Annualized Gain https://help.yahoo.com/kb/SLN22582.html which sounds like it could be right but I couldn’t find a stock with the value populated.
Hi Peter,
tnx for this great tutorial!
I’ve a little problem on decimal position, my Excel recognize the comma as decimal separator so all the numbers I retrieve don’t have the correct value.
There is a way to program the query for use comma as decimal separator?
TNX again,
Davide
Hmm yes that is a difficult problem. Whenever any US string data is converted to a type (dates and numbers) I should force the locale to be US. From looking at the code I think this line
= Table.TransformColumnTypes(#”YahooSource”, #”ColumnTypesList”)
should strictly be
= Table.TransformColumnTypes(#”YahooSource”, #”ColumnTypesList”, “en-US”)
Hi Peter,
This is Waleed.
Many thanks for this great work. I’m zero code. I have a sheet with list of symbols, and I need to download the estimated earning date for each one of them and update them automatically. I can get that from yahoo. For example the link for the next earning date for FB will be (https://biz.yahoo.com/research/earncal/f/fb.html), and for AAPL wil be (https://biz.yahoo.com/research/earncal/a/aapl.html). How can I make a query to get the respective dates for each symbol in my sheet? Thank you in advance. Waleed
I don’t see the Earning Date in the available fields in the yahoo finance query that I’m making. That makes is a more difficult task to populate in my spreadsheet. It can be done but it will take code
Was wondering are there any new ways to something similar to this now since yahoo’s data is no longer available. Kayla
Interesting
No I don’t yet have an alternative