Mature cloud platforms such as AWS and Azure have simplified infrastructure provisioning with toolsets such as CloudFormation and Azure Resource Manager (ARM) to provide an easy way to create and manage a collection of related infrastructure resources. Both tool sets allow developers and system administrators to use JavaScript Object Notation (JSON) to specify resources to provision, as well as provide the means to bootstrap systems, effectively allowing for single click fully configured environment deployments.
While these toolsets are an excellent means to prevent RSI from performing repetitive monotonous tasks, the initial writing and testing of templates and scripts can be incredibly time consuming. Troubleshooting and debugging bootstrap scripts usually involves logging into hosts and checking log files. These hosts are often behind firewalls, resulting in the need to use jump hosts which may be MFA integrated, all resulting in a reduced appetite for infrastructure as code.
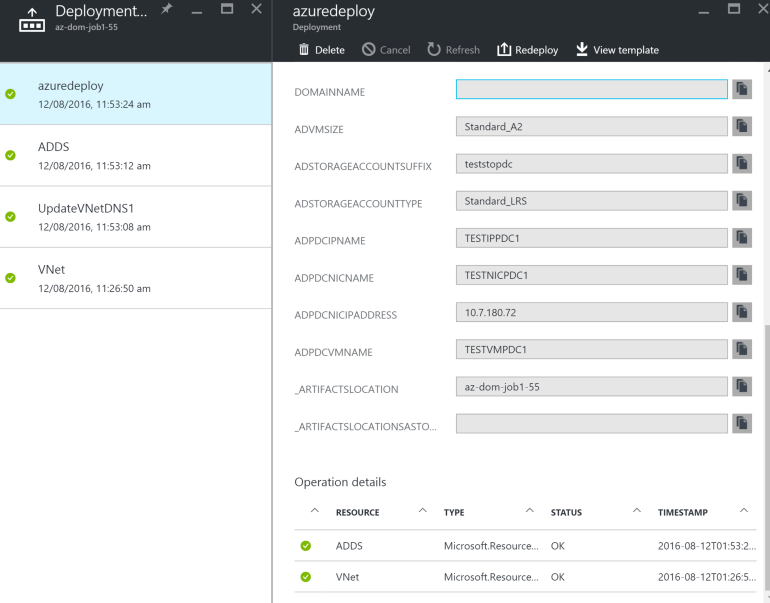
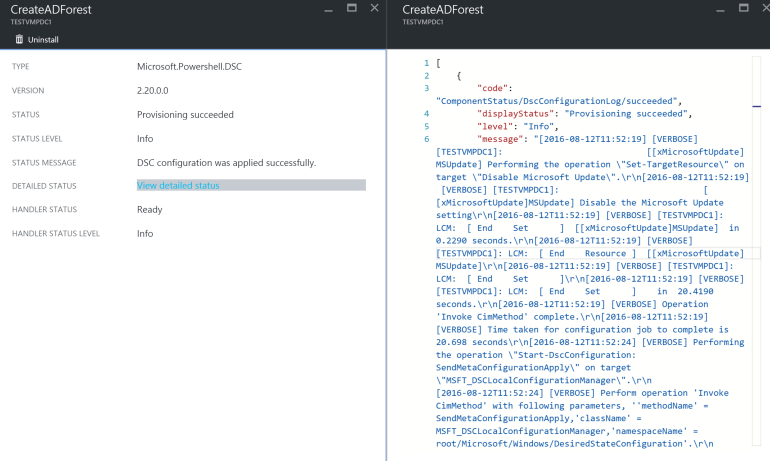
One of my favourite things about Azure is the ability to watch the ARM provisioning and host bootstrapping process through the console. Unless there’s a need to rerun a script on a host and watch it in real time, troubleshooting the deployment failure can be performed by viewing the ARM deployment history or viewing the relevant Virtual Machine Extension. Examples can be seen below:
While this seems simple enough in Azure, I found it a little less straight forward in AWS. Like Azure, bootstrap logs for the instance reside on the host itself, however the logs aren’t shown in the console by default. Although there’s a blog post on AWS to view CloudFormation logs in CloudWatch, it was tailored to Linux instances. Keen for a similar experience to Azure, I decided to put together the following instructional to have bootstrap logs appear in CloudWatch.
To enable CloudWatch for instances dynamically, the first step is to create an IAM role that can be attached to EC2 instances when they’re launched, providing them with access to CloudWatch. The following JSON code shows a sample policy I’ve used to define my IAM role.
The next task is to create a script that can be used at the start of the bootstrap process to dynamically enable the CloudWatch plugin on the EC2 instance. The plugin is disabled by default and when enabled, requires a restart of the EC2Config service. I used the following script:
It’s worth noting that the EC2Config service is set to recover by default and therefore starts by itself after the process is killed.
Now that we’ve got a script to enable the CloudWatch plugin, we need to change the default CloudWatch config file on the host prior to enabling the CloudWatch plugin. The default CloudWatch config file is AWS.EC2.Windows.CloudWatch.json and contains details of all the logs that should be monitored as well as defining CloudWatch log groups and log streams. Because there’s a considerable number of changes made to the default file to achieve the desired result, I prefer to create and store a customised version of the file in S3. As part of the bootstrap process, I download it to the host and place it in the default location. My customised CloudWatch config file looks like the following:
Let’s take a closer look at what’s happening here. The first three components are windows event logs I’m choosing to monitor:
You’ll notice I’ve included the Desired State Configuration (DSC) event logs, as DSC is my preferred configuration management tool of choice when it comes to Windows. When defining a windows event log, a level needs to be specified, indicating the verbosity of the output. The values are as follows:
1 – Only error messages uploaded.
2 – Only warning messages uploaded.
4 – Only information messages uploaded.
You can add values together to include more than one type of message. For example, 3 means that error messages (1) and warning messages (2) get uploaded. A value of 7 means that error messages (1), warning messages (2), and information messages (4) get uploaded. For those familiar with Linux permissions, this probably looks very familiar! 🙂
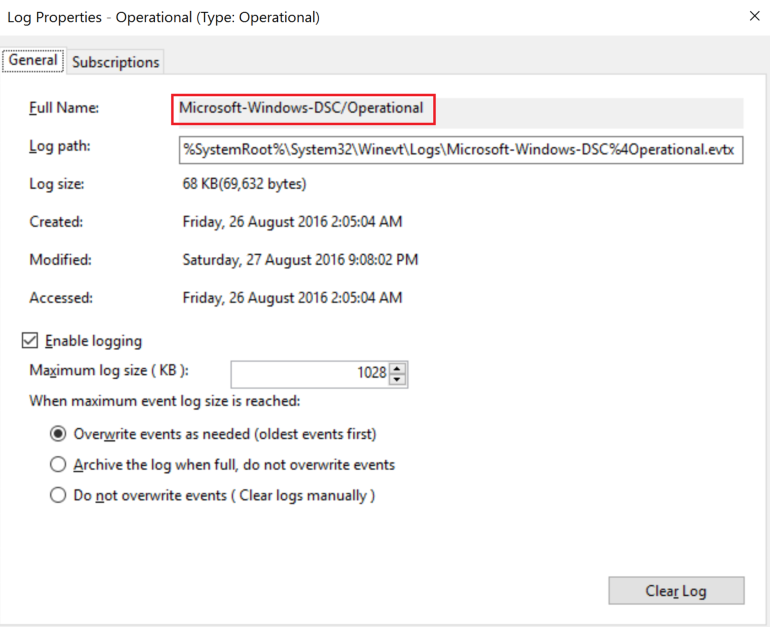
To monitor other windows event logs, you can create additional components in the JSON template. The value of “LogName” can be found by viewing the properties of the event log file, as shown below:
The next two components monitor the two logs that are relevant to the bootstrap process:
Once again, a lot of this is self explanatory. The “LogDirectoryPath” specifies the absolute directory path to the relevant log file, and the filter specifies the log filename to be monitored. The tricky thing here was getting the “TimeStampFormat” parameter correct. I used this article on MSDN plus trial and error to work this out. Additionally, it’s worth noting that cfn-init.log’s timestamp is the local time of the EC2 instance, while EC2ConfigLog.txt takes on UTC time. Getting this right ensures you have the correct timestamps in CloudWatch.
Next, we need to define the log groups in CloudWatch that will hold the log streams. I’ve got three separate Log Groups defined:
You’ll also notice that the Log Streams are named after the instance ID. Each instance that is launched will create a separate log stream in each log group that can be identified by its instance ID.
Finally, the flows are defined:
This section specifies which logs are assigned to which Log Group. I’ve put all the WindowsEventLogs in a single Log Group, as it’s easy to search based on the event log name. Not as easy to differentiate between cfn-init.log and EC2ConfigLog.txt entries, so I’ve split them out.
So how do we get this customised CloudWatch config file into place? My preferred method is to upload the file with the set-cloudwatch.ps1 script to a bucket in S3, then pull them down and run the PowerShell script as part of the bootstrap process. I’ve included a subset of my standard cloudformation template below, showing the monitoring config key that’s part of the ConfigSet.
What does this look like in the end? Here we can see the log groups specified have been created:
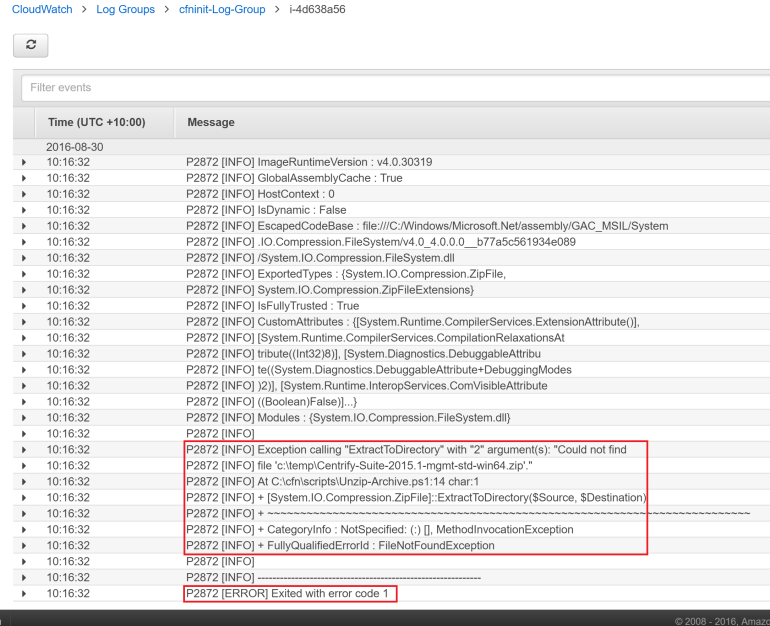
If we drill further down into the cfninit-Log-Group, we can see the instance ID of the recently provisioned host. Finally, if we click on the Instance ID, we can see the cfn-init.log file in all its glory. Yippie!
Hummm, looks like my provisioning failed because a file is non-existent. Bootstrap monitoring has clearly served its purpose! Now all that’s left to do is to teardown the infrastructure, remediate the issue, and reprovision!
The next step to reducing the amount of repetitive tasks in the infrastructure as code development process is a custom pipeline to orchestrate the provisioning and teardown workflow… More on that in another blog!


