The Azure Application Gateway has a Web Application Firewall (WAF) capability that can be enabled on the gateway. The WAF will use the OWASP ModSecurity Core Rule Set 3.0 by default and there is an option to use CRS 2.2.9.
CRS 3.0 offers reduced occurrences of false positives over 2.2.9 by default. However, there may still be times when you need to tune your WAF rule sets to avoid false positives in your site.
Blocked access to the site
The Azure WAF filters all incoming requests to the servers in the backend of the Application Gateway. It uses the ModSecurity Core Rule Sets described above to protect your sites against various items such as code injections, hack attempts, web attacks, bots and mis-configurations.
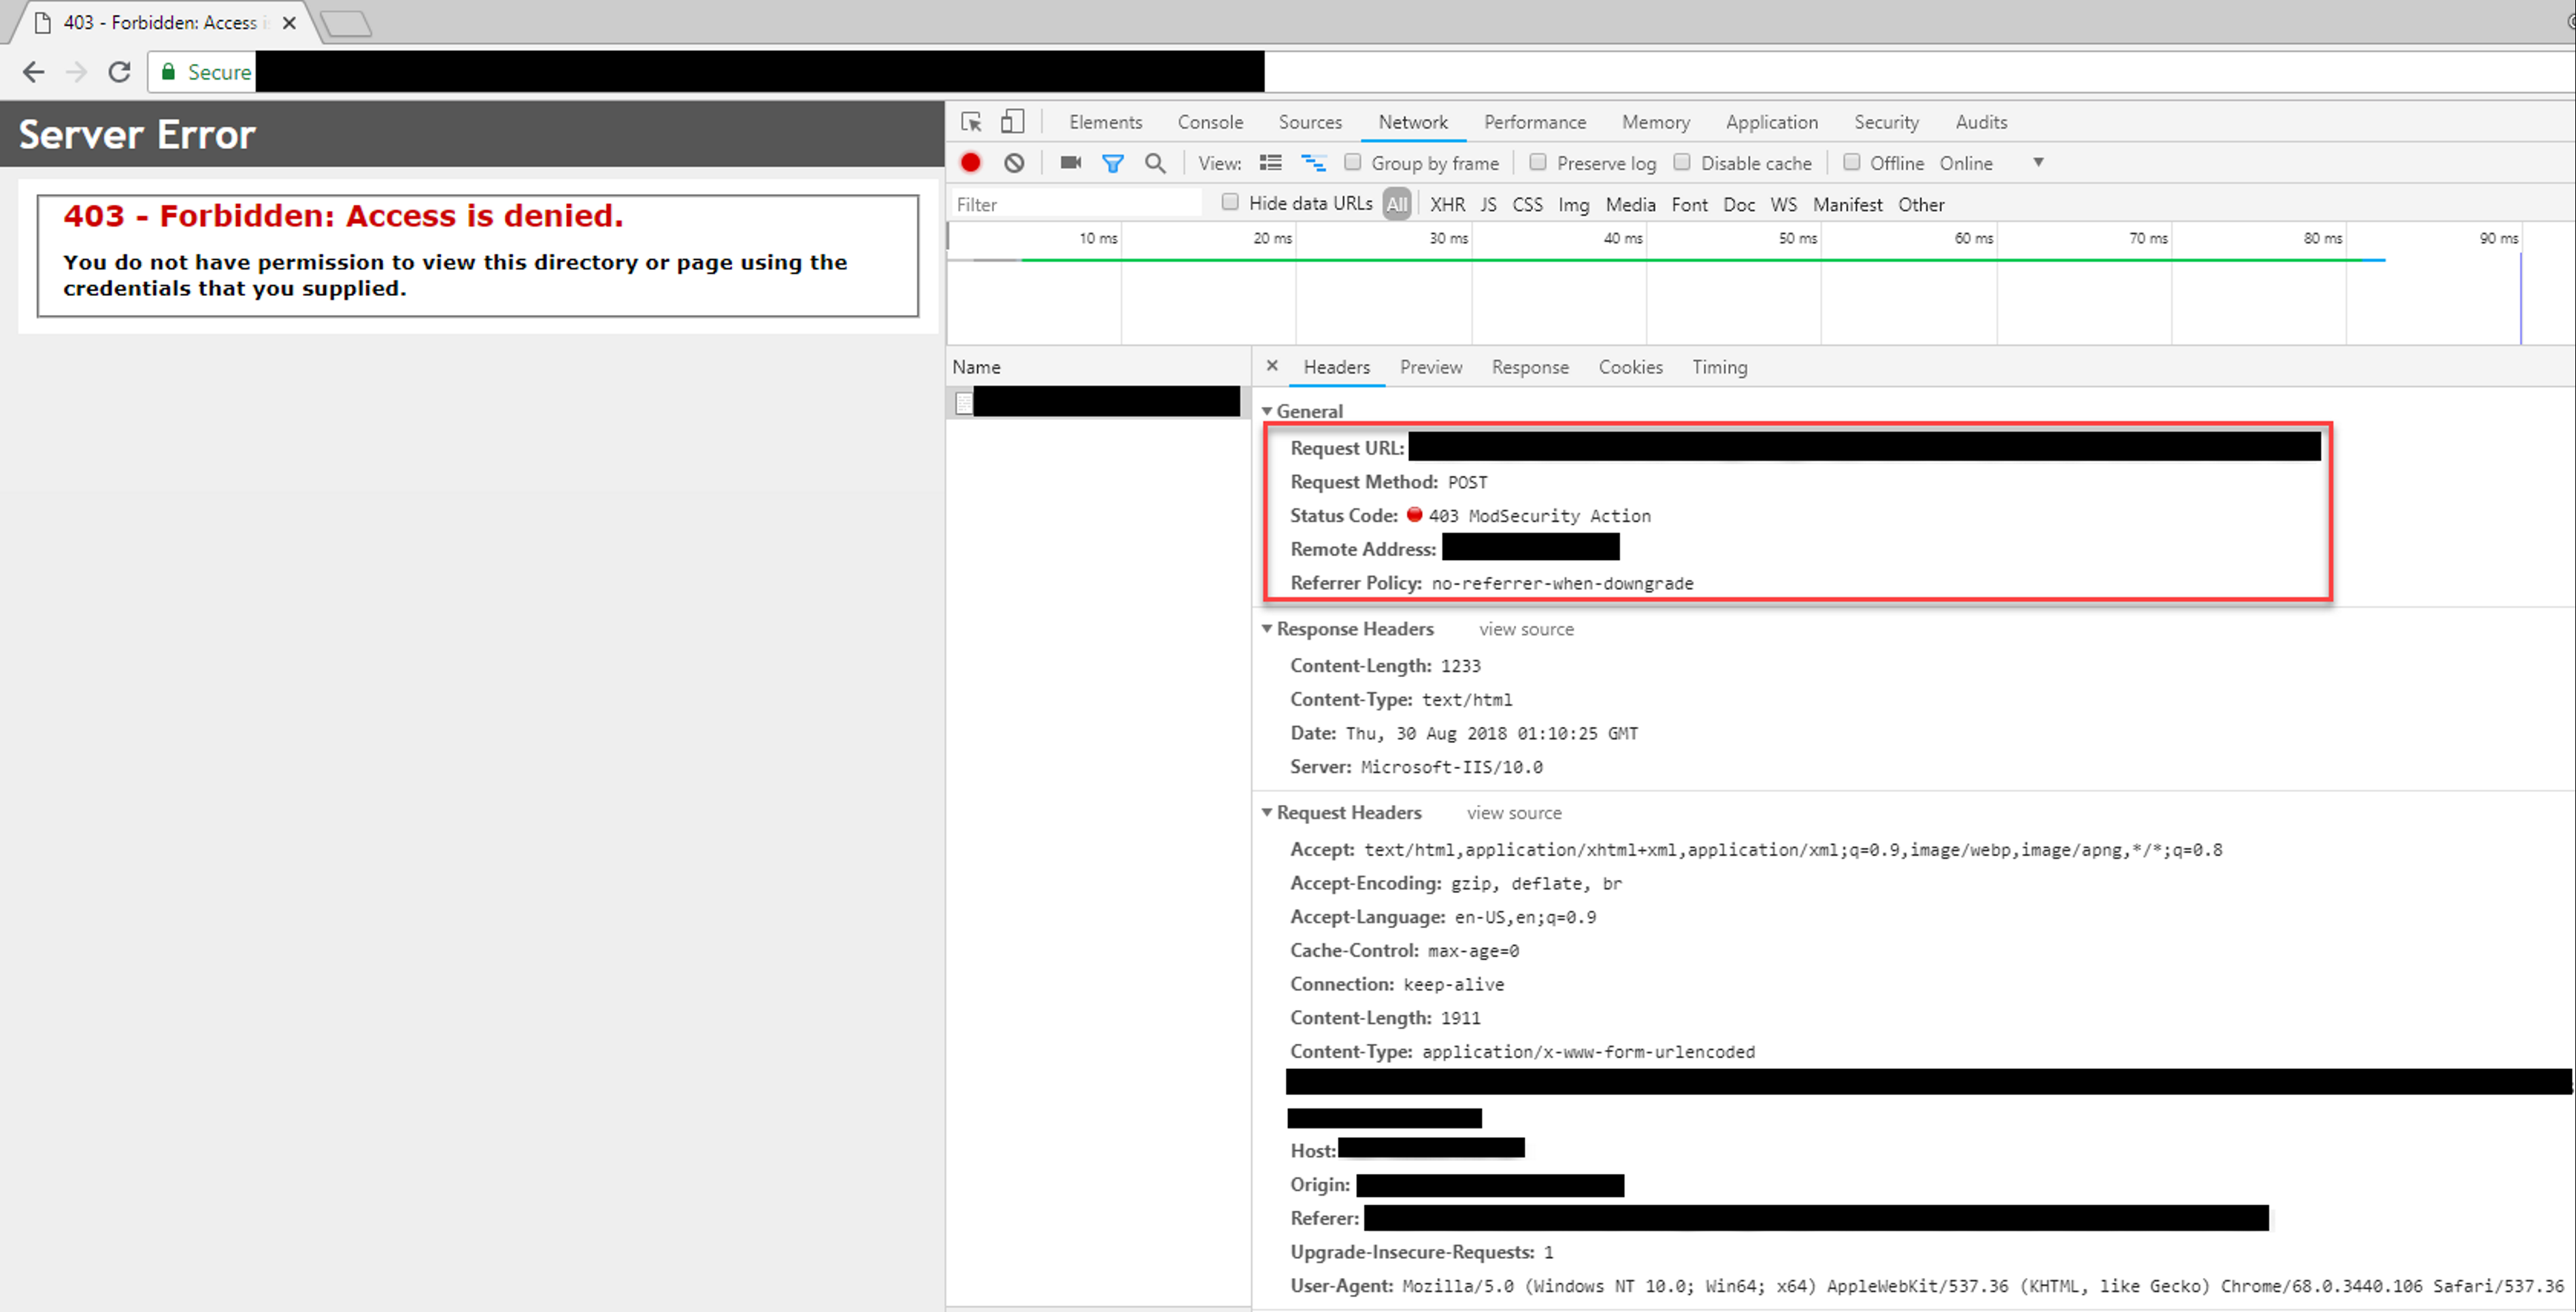
When the threshold of rules are triggered on the WAF, access is denied to the page and a 403 error is returned. In the below screenshot, we can see that the WAF has blocked access to the site, and when viewing the page in Chrome tools under Network -> Headers we can see that the Status Code is 403 ModSecurity Action
Enable WAF Diagnostics
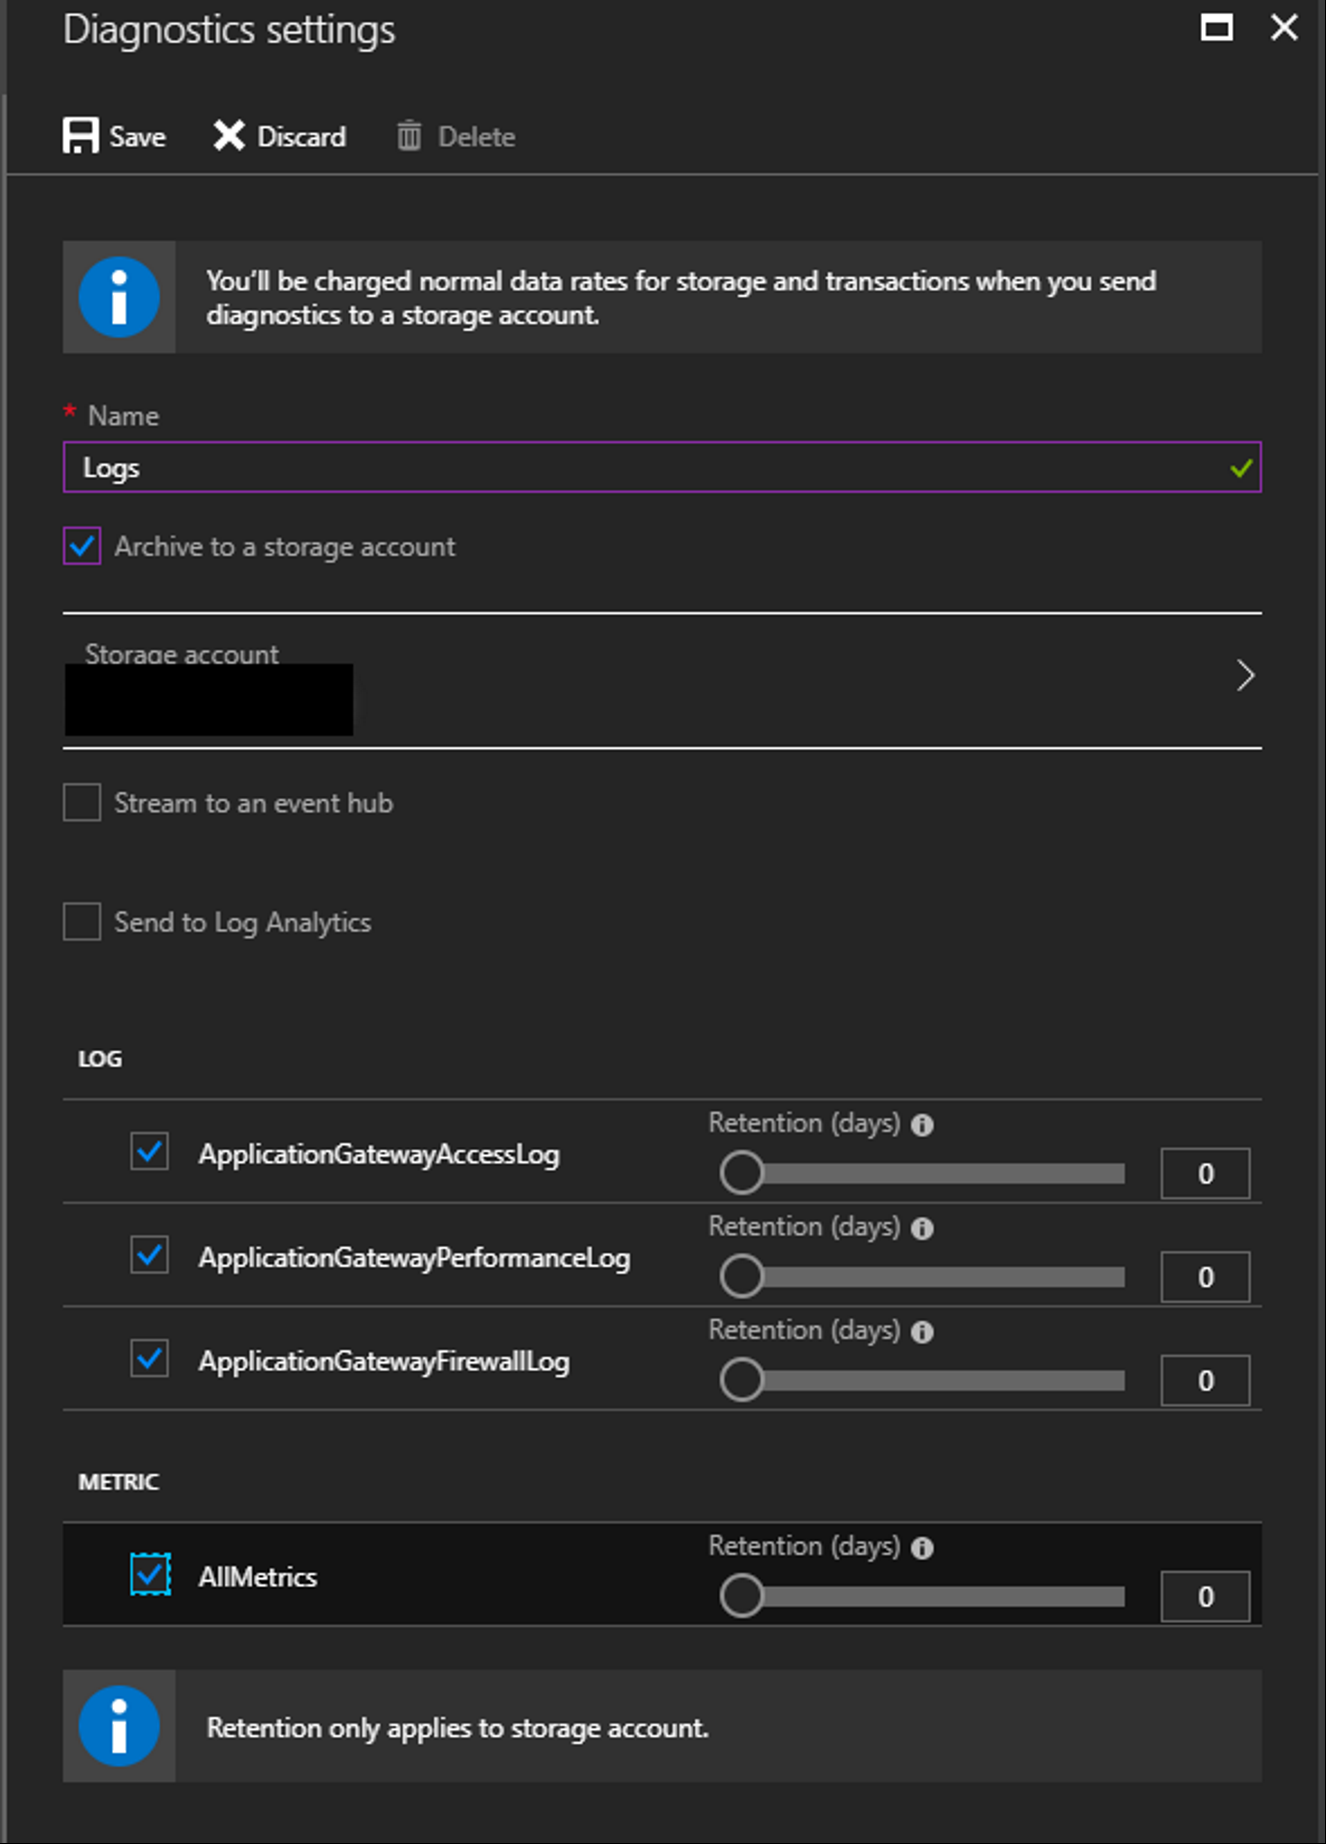
To be able to view more information on the rules that are being triggered on the WAF you will need to turn on Diagnostic Logs, you do this by adding a diagnostic setting. There are different options for configuring the diagnostic settings but in this example we will direct them to an Azure Storage Account.
Viewing WAF Diagnostic Logs
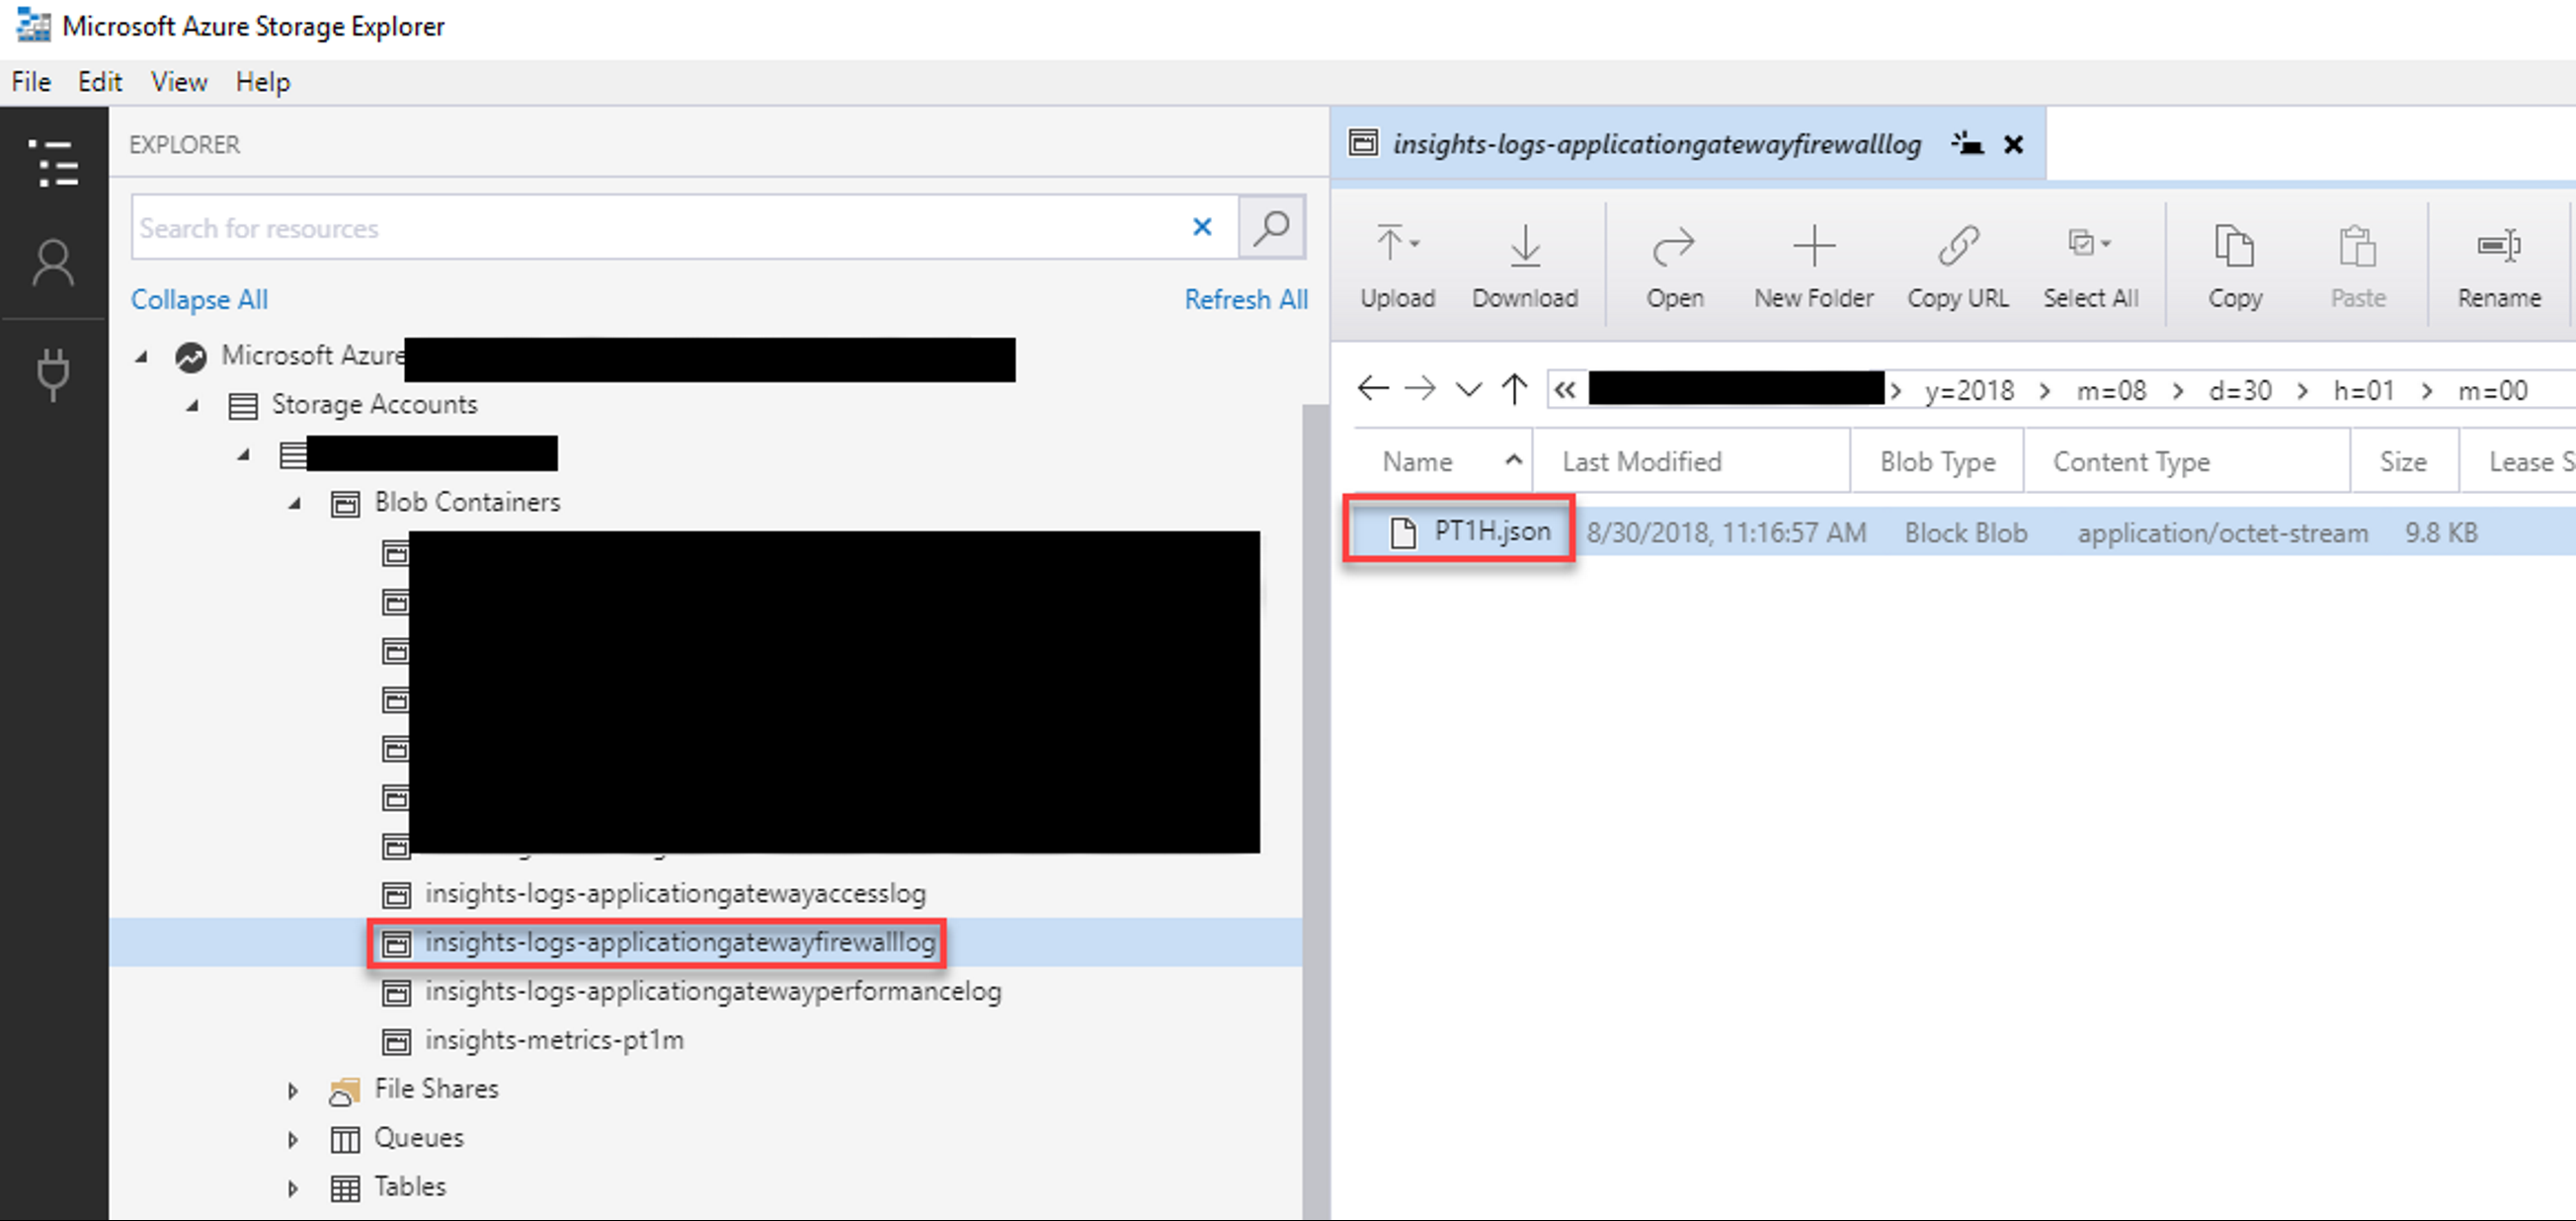
Now that diagnostic logging is enabled for the WAF to direct to a storage account we can browse to the storage account and view the log files. An easy way to do this is to download the Azure Storage Explorer. You can then use it to browse the storage account and you will see 3 containers that are used for the Application Gateway logging.
- insights-logs-applicationgatewayaccesslog
- insights-logs-applicationgatewayfirewalllog
- insights-logs-applicationgatewayperformancelog
The container that we are interested in for the WAF logs is the insights-logs-applicationgatewayfirewalllog container.
Navigate through the container until you find the PT1H.json file. This is the hourly log of firewall actions on the WAF. Double click on the file and it will open in the application set to view json files.
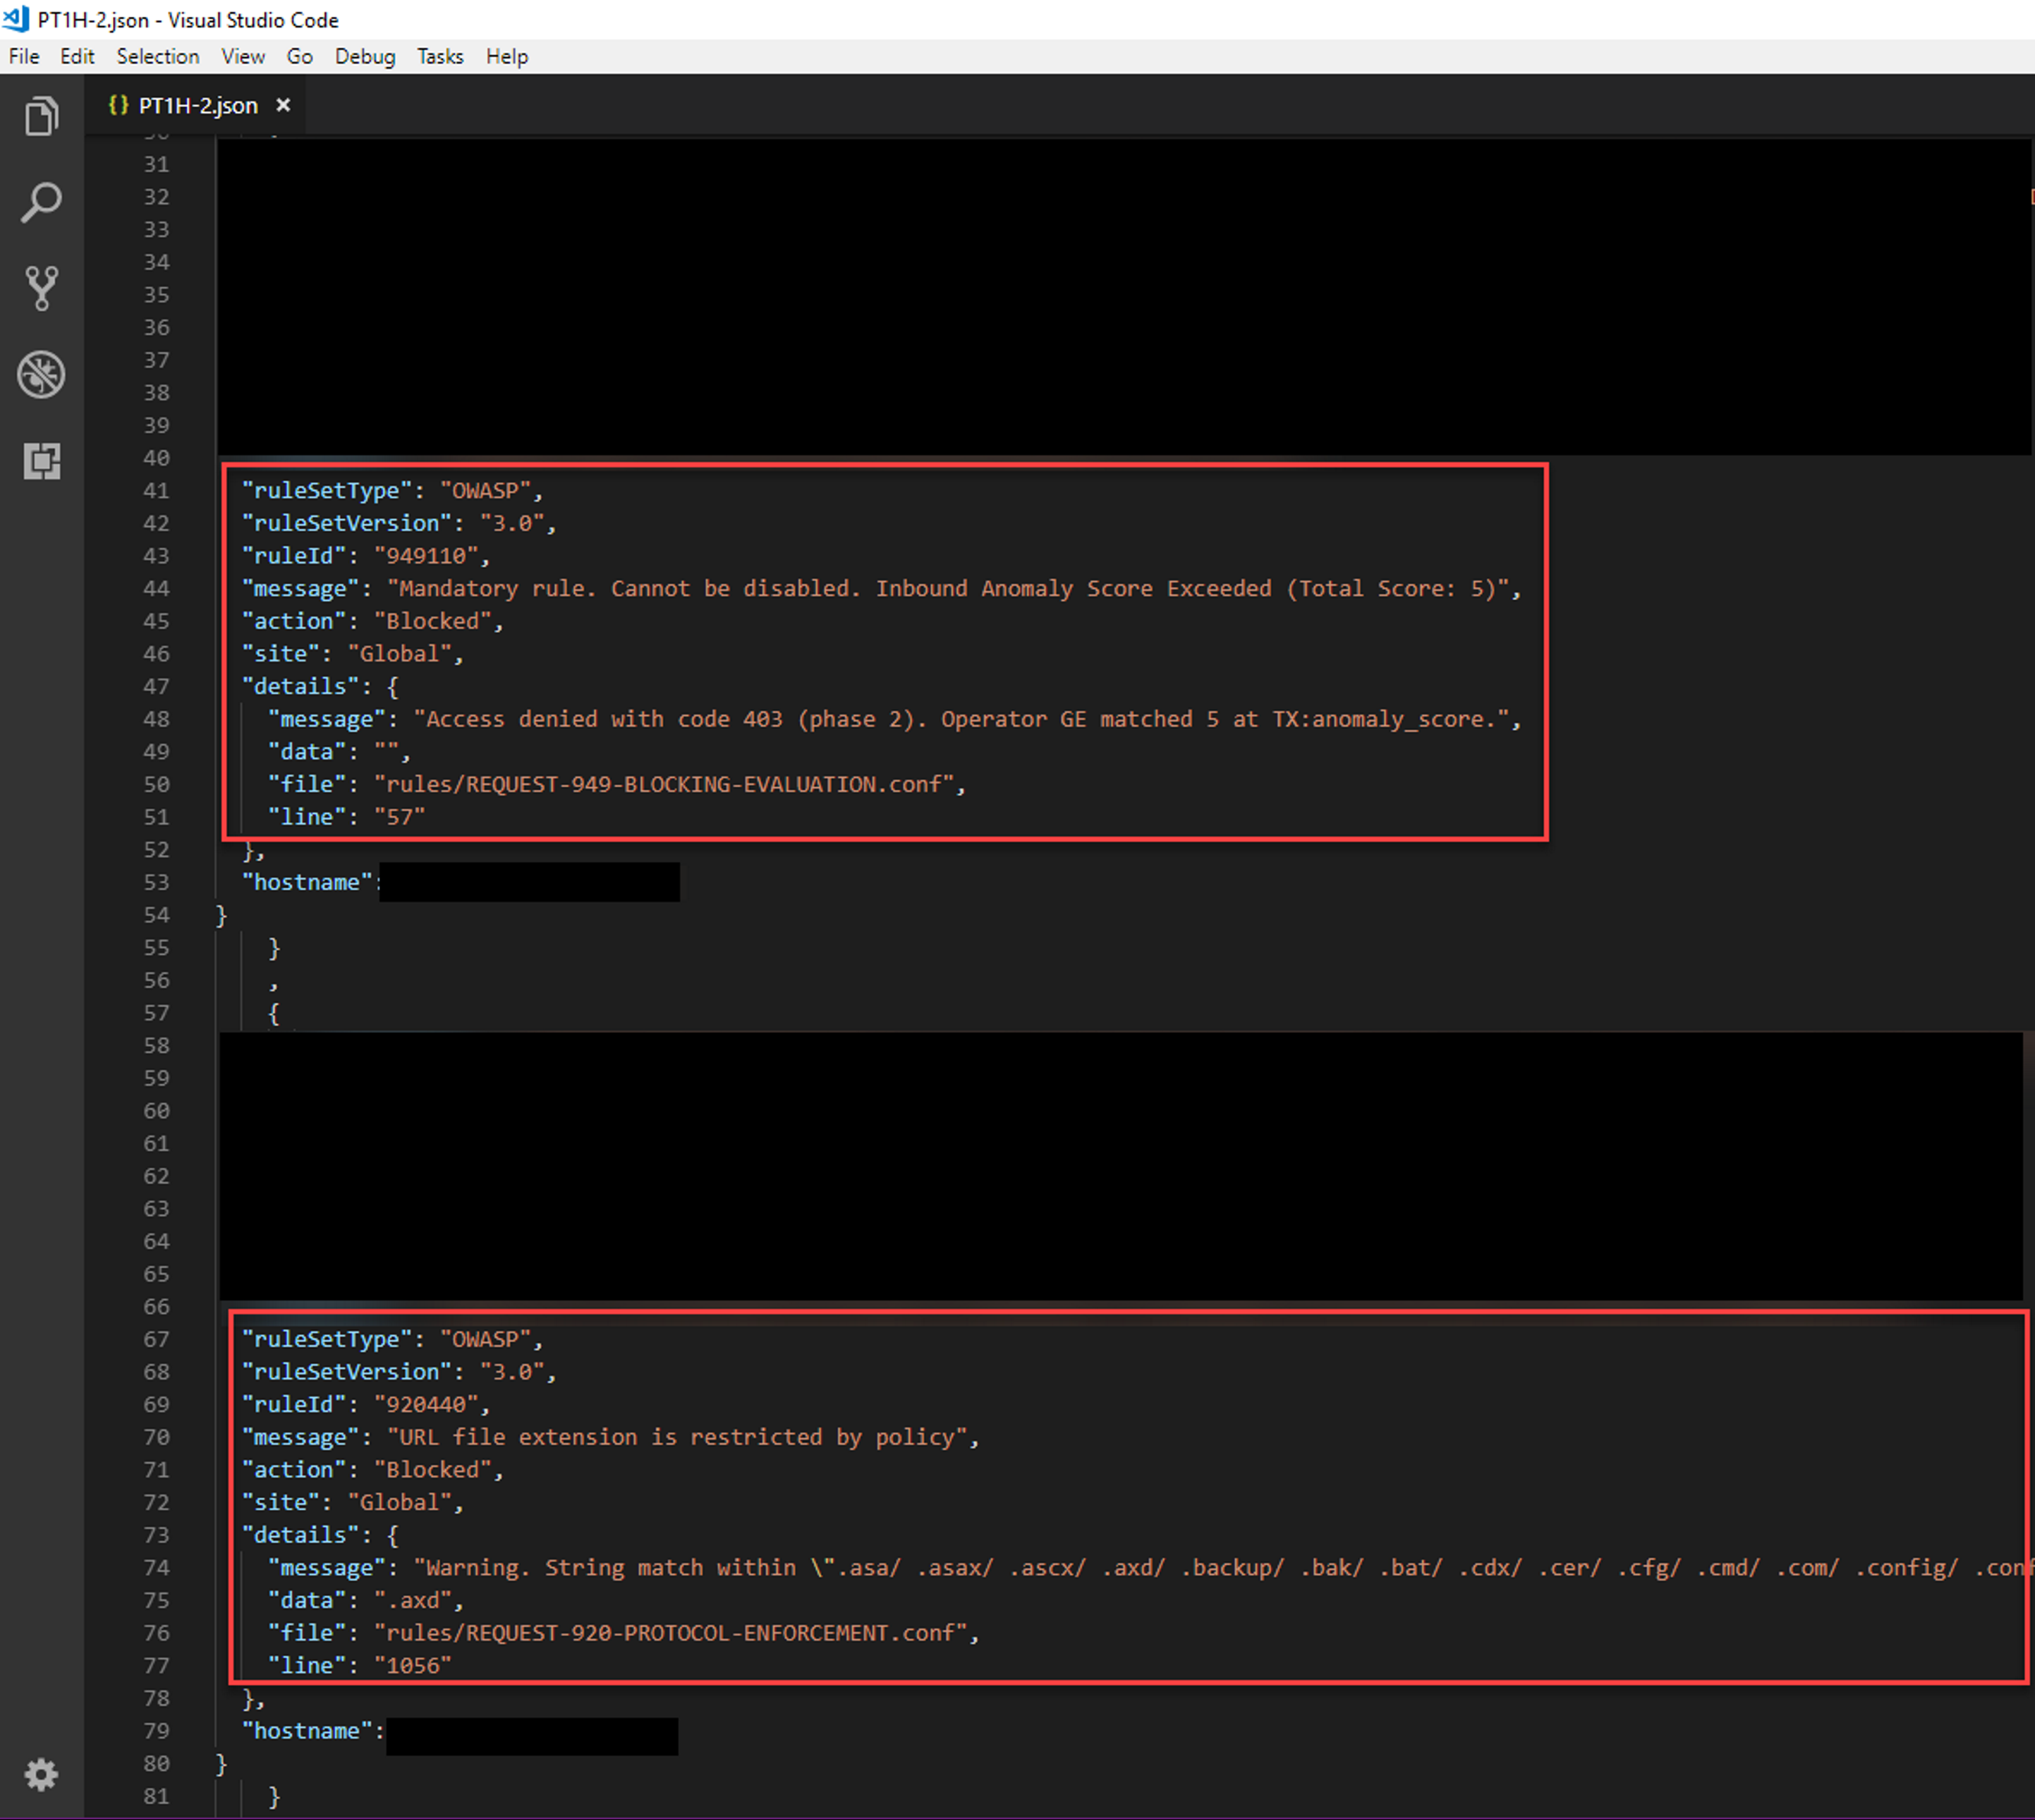
Each entry in the WAF will include a information about the request and why it was triggered such as the ruleID, Message details. In the below sample log there are 2 highlighted entries.
The message details for the first highlighted log indicate the following “Access denied with code 403 (phase 2). Operator GE matched 5 at TX:anomaly_score.“.
So we can see that when the anomaly threshold of 5 was reached the WAF triggered the 403 ModSecurity action that we initially saw from the browser when trying to access the site. It is also important to notice that this particular rule cannot be disabled, and it indicates that it is an accumulation of rules being triggered.
The second rule indicates that a file with extension .axd is being blocked by a policy.
Tuning WAF policy rules
Each of the WAF log entries that are captured should be carefully reviewed to determine if they are valid threats. If after reviewing the logs you are able to determine that the entry is a false positive or the log captures something that is not considered a risk you have the option to tune the rules that will be enforced.
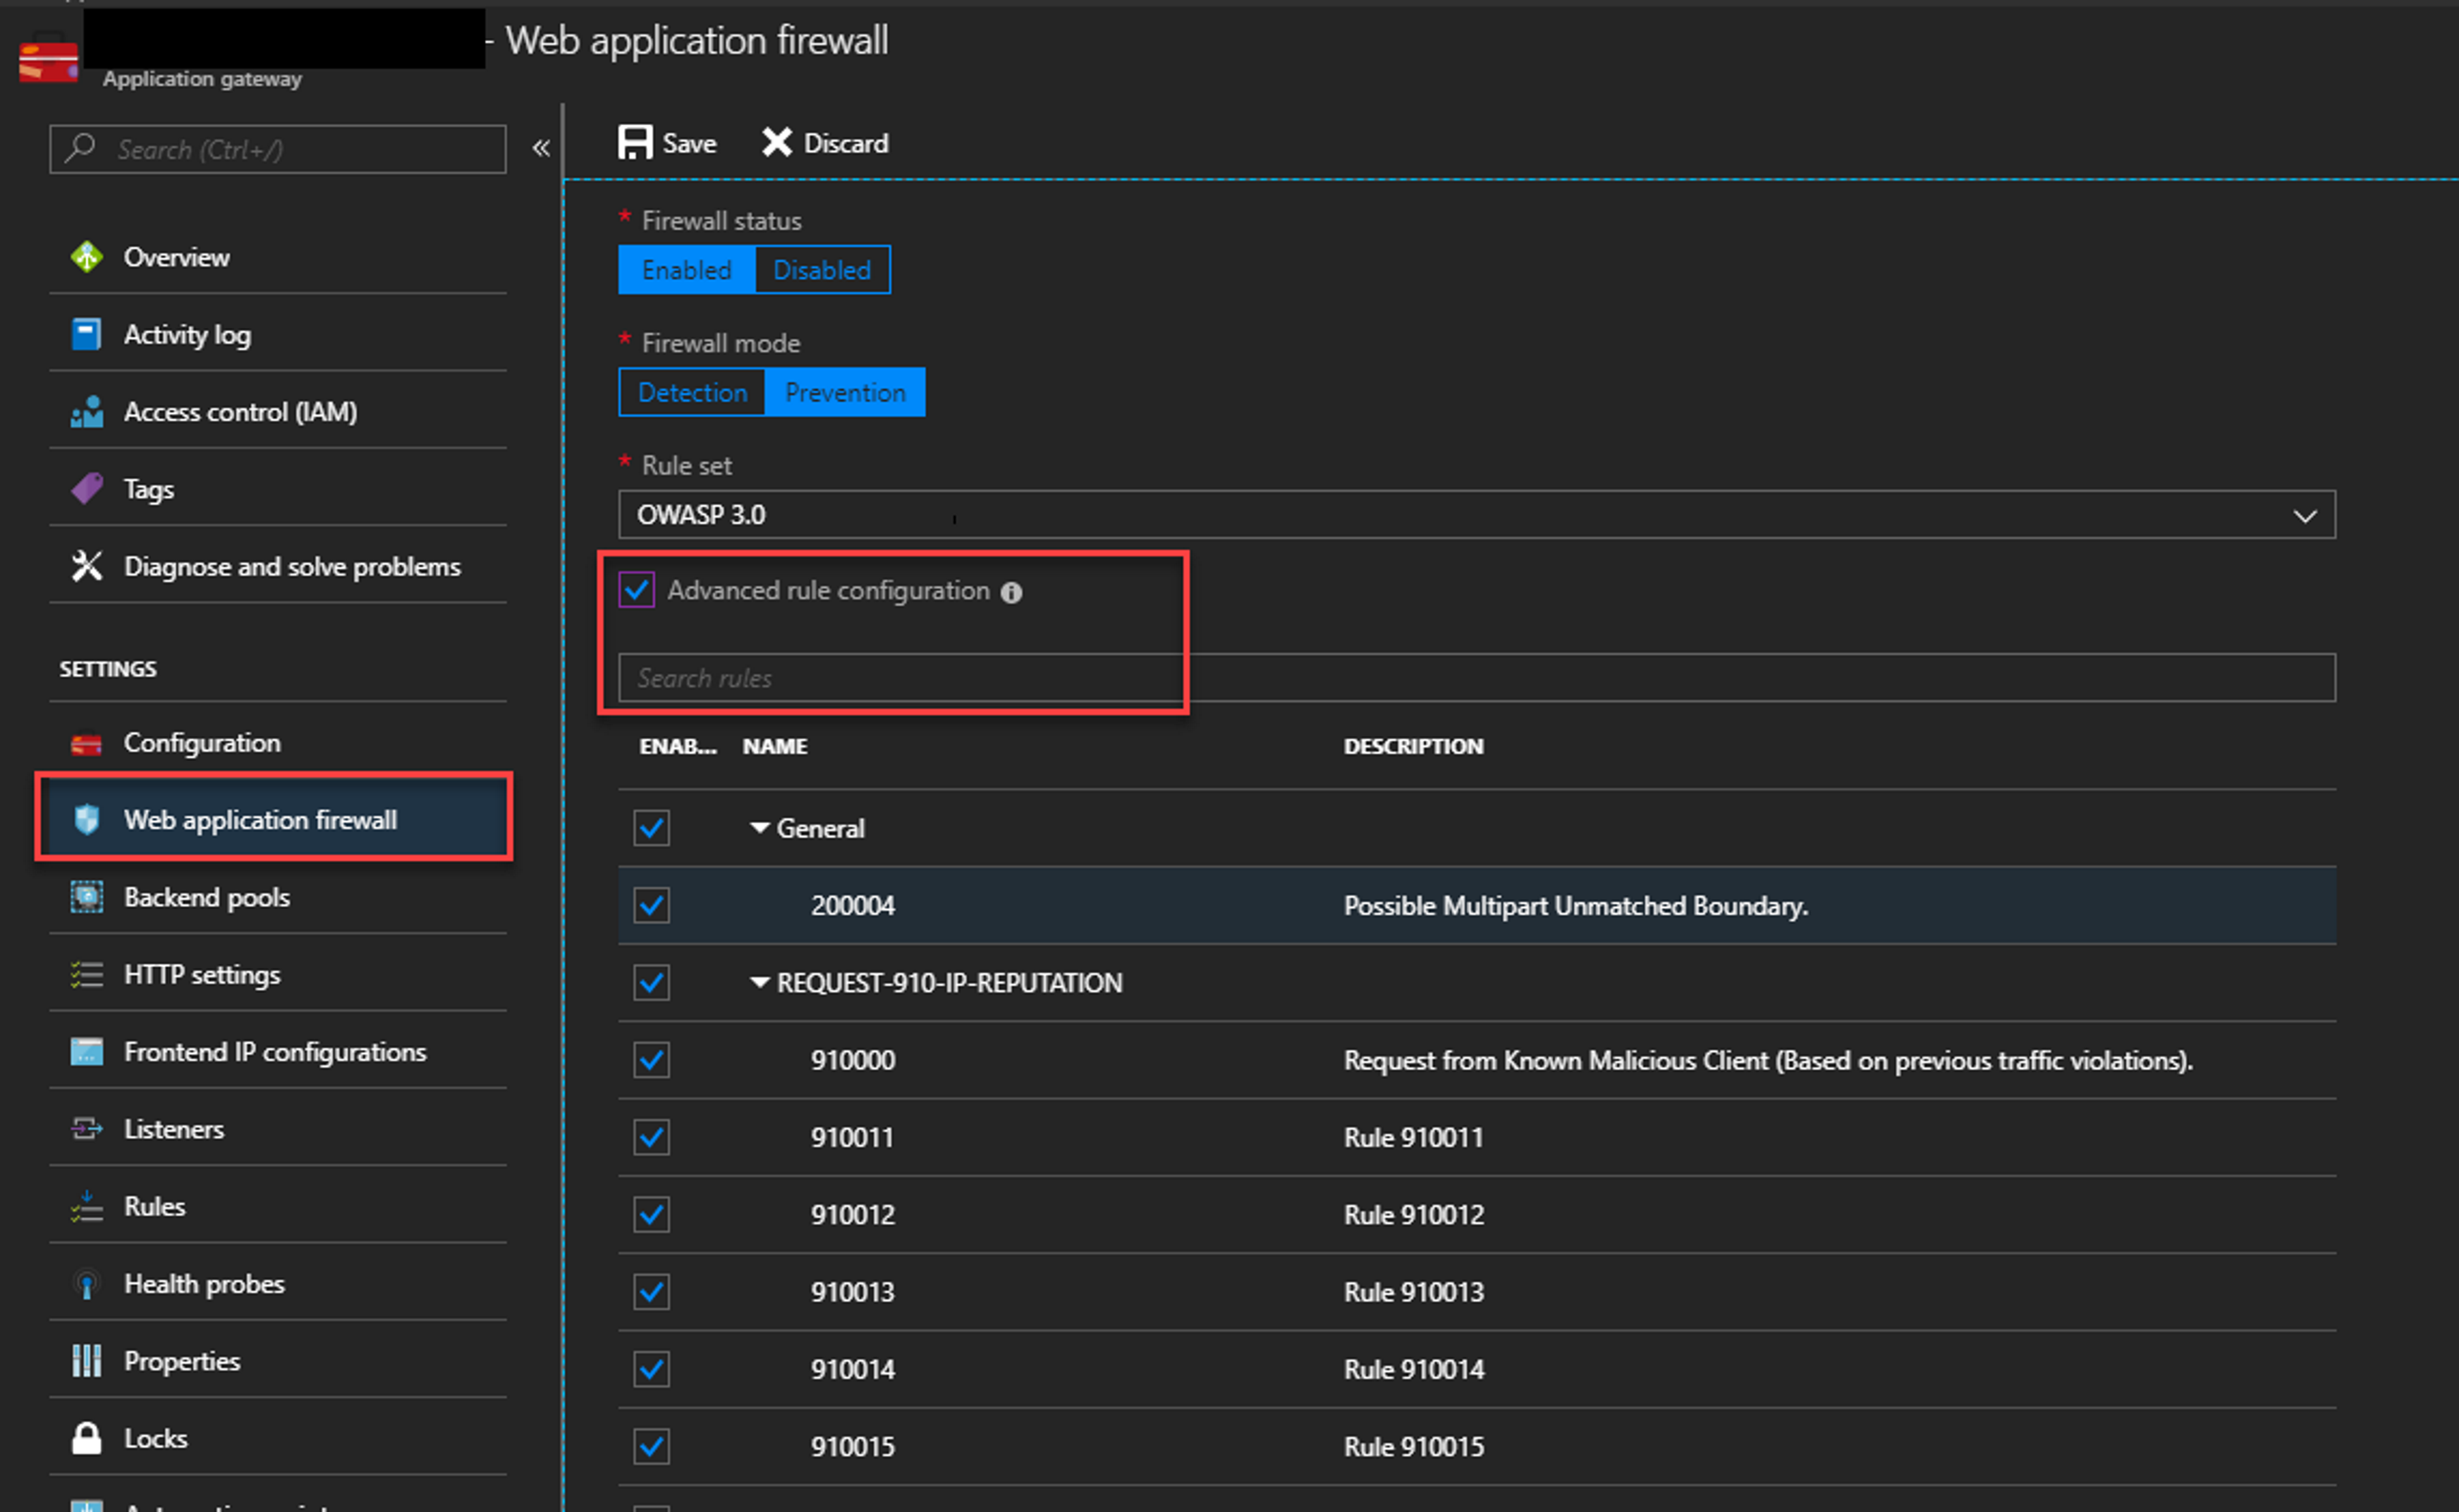
From the Web Application Firewall section within the Application Gateway you have the following options:
- Enable or Disable the WAF
- Configure Detection or Prevention modes for the WAF
- Select rule set to use
- Customize rule configuration
In the example above, if we were to decide that the .axd file extension is valid and allowed for the site we could search for the ruleID 9420440 and un-select it.
Once the number of rules being triggered reduces below the inbound threshold amount the 403 ModSecurity Action will no longer prevent access to the site.
For new implementations or during testing you could apply the Detection mode only and view and fine tune the WAF prior to enabling for production use.

Good article, tell us how to put the JSON files in a proper report. Wading through JSON files is not a good way to look at WAF alerts.
Totally agree. I’m very surprised there is no way to see this easily on Azure Portal
We use Log Analytics – for a typical deployment this should fall under the 5GB limit, making the solution free: https://docs.microsoft.com/en-us/azure/azure-monitor/log-query/get-started-portal