Agile teams are often under scrutiny as they find their feet and as their sponsors and stakeholders realign expectations. Teams can struggle due to many reasons. I won’t list them here, you’ll find many root causes online and may have a few yourself.
Accordingly, this article is for Scrum Masters, Delivery Managers or Project Managers who may work to help turn struggling teams into high performing machines. The key to success here is measures, measures and measures.
I have a technique I use to performance manage agile teams involving specific Key Performance Indicators (KPIs). To date it’s worked rather well. My overall approach is as follows:
- Present the KPIs to the team and rationalise them. Ensure you have the team buy-in.
- Have the team initially set targets against each KPI. It’s OK to be conservative. Goals should be achievable in the current state and subsequently improved upon.
- Each sprint, issue a mid-sprint report, detailing how the team is tracking against KPIs. Use On Target and Warning, respectively to indicate where the team has to up it’s game.
- Provide a KPI de-brief as part of the retrospective. Provide insight into why and KPIs were not satisfied.
- Work with the team on setting the KPIs for the next sprint at the retrospective
I use a total of five KPIs, as follows:
- Total team hours worked (logged) in scrum
- Total [business] value delivered vs projected
- Estimation variance (accuracy in estimation)
- Scope vs Baseline (effectiveness in managing workload/scope)
- Micro-Velocity (business value the team can generate in one hour)
I’ve provided a Agile Team Performance Tracker for you to use that tracks some of the data required to use these measures. Here’s an example dashboard you can build using the tracker (click to enlarge):

In this article, I’d like to cover some of these measures in detail, including how tracking these measures can start to affect positive change in team performance. These measures have served me well and help to provide clarity to those involved.
Estimation Variance
Estimation variance is a measure I use to track estimation efficiency over time. It relies on the team providing hours based estimates for work items but is attributable to your points based estimates. As a team matures and gets used to estimation. I expect the time invested to more accurately reflect what was estimated.
I define this KPI as a +/-X% value.
So for example, if the current Estimation Variance is +/-20%, it means the target for team hourly estimates, on average for work items in this sprint, should be tracking no more than 20% above or below logged hours for those work items. I calculate the estimation variance as follows:
[estimation variance] = ( ([estimated time] / [actual time]) / [estimated time] ) x 100
If the value is less than the negative threshold, it means the team is under-estimating. If the value is more than the positive threshold, it means the team is over-estimating. Either way, if you’re outside the threshold, it’s bad news.
“But why is over-estimating an issue?” you may ask yourself? “An estimate is just an estimate. The team can simply move more items from the backlog into the sprint“. Remember that estimates are used as baselining for future estimates and planning activities. A lack of discipline in this area may impede release dates for your epics.
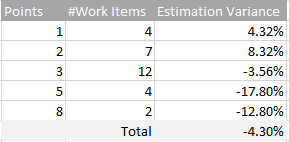
You can use this measure against each of the points tiers your team uses. For example:

n this example, the team is under-estimating bigger ticket items (5’s and 8’s), so targeted efforts can be made next estimation session to bring this within target threshold. Overall though in this example the team is tracking pretty well – the overall variance of -4.30% could well be within target KPI for this sprint.
Scope vs Baseline
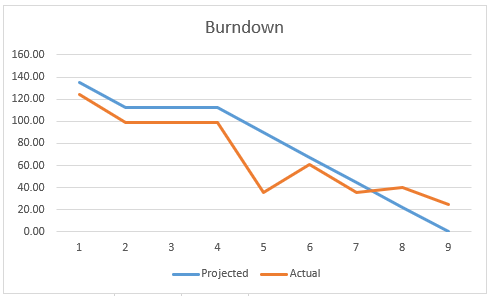
Scope vs Baseline is a measure used to assess the team’s effectiveness at managing scope. Let’s consider the following 9-day sprint burndown:

The baseline represents the blue line. This is the projected burn-down based on the scope locked in at the start of the sprint. The scope is the orange line, representing the total scope yet to be delivered on each day of the sprint.
Obviously, a strong team tracks against or below the baseline, and will take on additional scope to stay aligned to the baseline without falling too far below it. Teams that overcommit/underdeliver will ‘flatline (not burn down) and track above the baseline, and even worse may increase scope when tracking above the baseline.
The Scope vs Baseline measure is tracked daily, with KPI calculation an average across all days in the sprint.
I define this KPI as a +/-X% value.
So for example, if the current Scope vs Baseline is +/-10%, it means the actual should not track on average more than 10% above or below the baseline. I calculate the estimation variance as follows:
[scope vs baseline] = ( [actual / projected] * 100 ) – 100
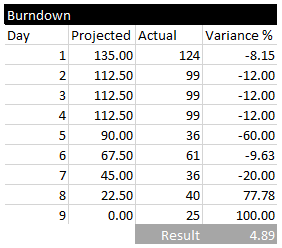
Here’s an example based on the burndown chart above:

The variance column stores the value for the daily calculation. The result is the Scope vs Baseline KPI (+4.89%). We see the value ramp up into the positive towards the end of sprint, representing our team’s challenge closing out it’s last work items. We also see the team tracking at -60% below the baseline on day 5, which subsequently triggers a scope increase to track against the baseline – a behaviour indicative of a good performing team.
Micro-Velocity
Velocity is the most well known measure. If it goes up, the team is well oiled and delivering business value. If it goes down, it’s the by-product of team attrition, communication breakdowns or other distractions.
Velocity is a relative measure, so whether it’s good or bad depends on the team and the measures taken in past sprints.
What I do is create a variation on the velocity measure that is defined as follows:
[micro velocity] = SUM([points done]) / SUM([hours worked])
I use a daily calculation of macro-velocity (vs past iterations) to determine the impact team attrition and on-boarding new users will have within a single sprint.
In conclusion, using some measures as KPIs on top of (but dependent on) the reports provided by the likes of Jira and Visual Studio Online can really help a team to make informed decisions on how to continuously improve. Hopefully some of these measures may be useful to you.
